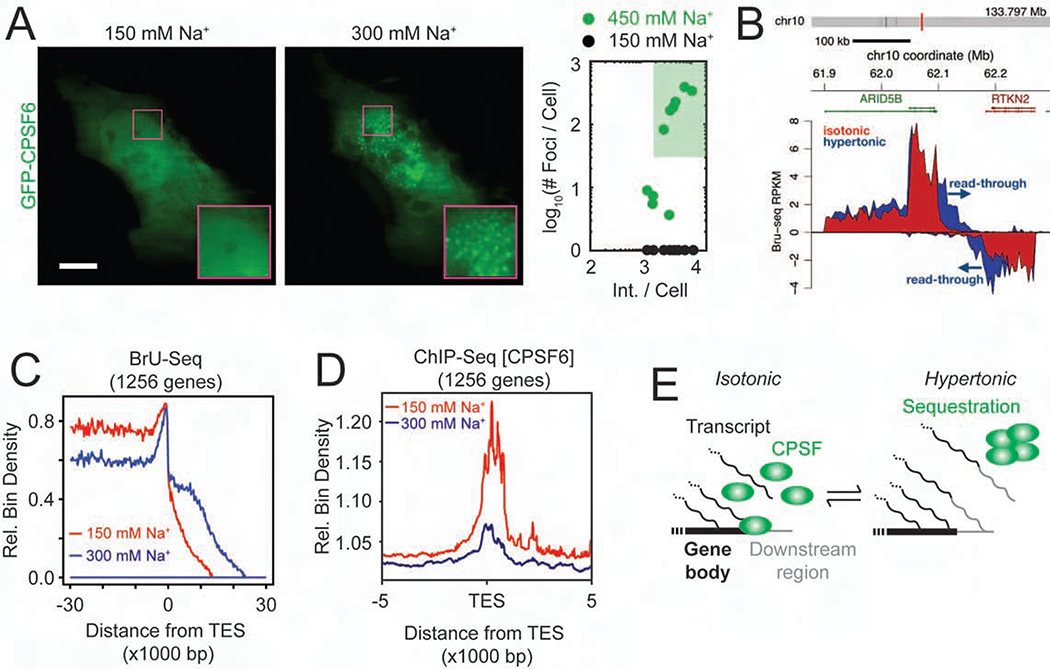
Figure 6. HOPS of CPSF6 is correlated with impaired transcription termination.
(A) Representative pseudocolored images of a U2OS cell transfected with GFP-CPSF6 (green) incubated with isotonic (150 mM Na+, red) medium and then treated with hypertonic (300 mM Na+, blue) medium for 1 min. Scale bar, 10 μm. (B) Bru-seq tracks across the ARID5B and RTKN2 genes showing transcriptional read-through of the TES. (C) Aggregate nascent RNA Bru-Seq enrichment profile across TESs. Relative bin density of ~1256 genes expressed >0.5 RPKM and >30 kb long showing an ~10 kb average extension of reads past the TES following exposure to hypertonic conditions for 30 min. Samples were prepared from cells treated with isotonic (150 mM Na+, red) or hypertonic (300 mM Na+, blue) medium for 30 min. (D) Aggregated ChIP-seq peaks of CPSF6 around the TES under hypertonic (300 mM Na+, blue) and isotonic conditions (300 mM Na+, red). (E) Schematic model of transcription termination defect induced by HOPS of CPSFs. See also Figure S6.

