
Figure 2.
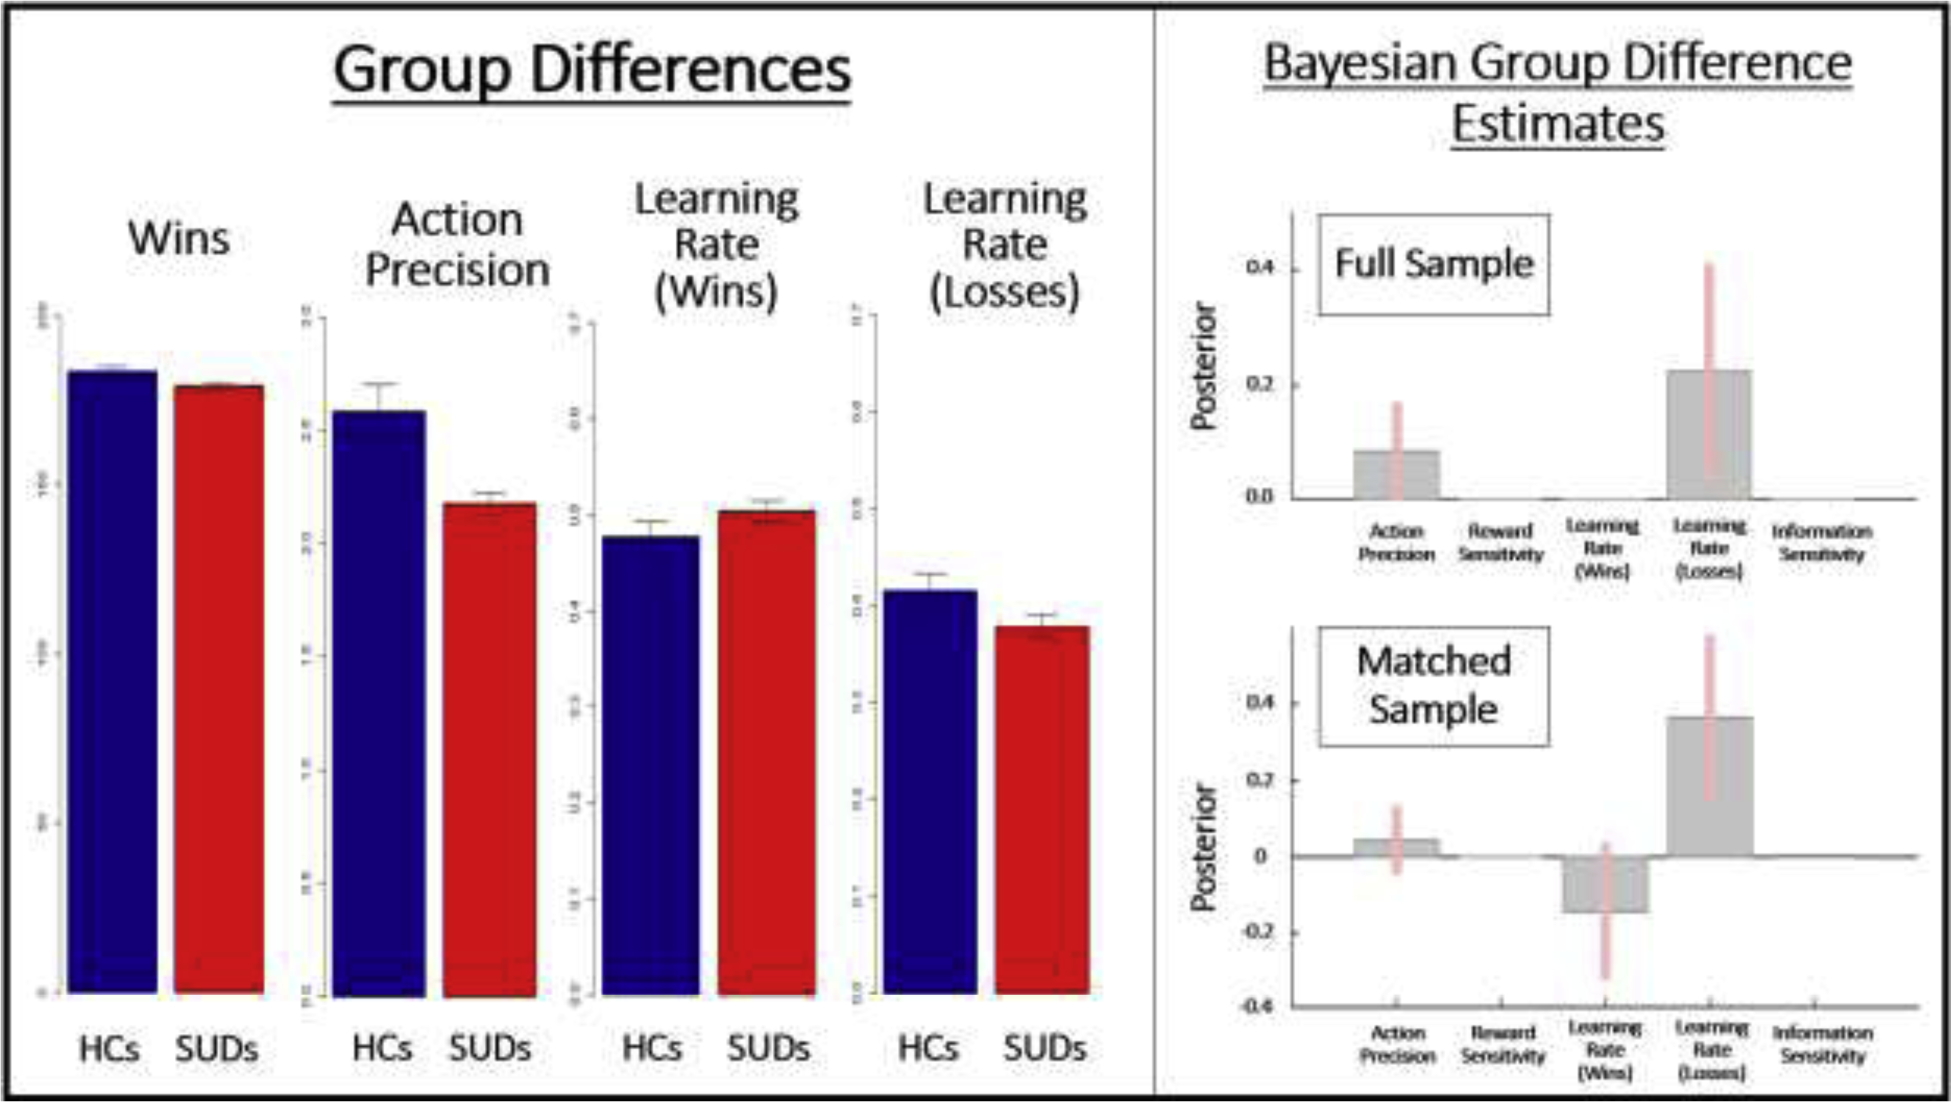
Left: Means and standard errors for significant group differences in model-based and model-free measures. HCs = healthy controls, SUDs = substance use disorders. Data displayed is based on the full sample of 54 HCs and 147 individuals with SUDs. Right: Results of parametric empirical Bayes (PEB) analyses, showing the posterior means and variances for group difference estimates in the full and propensity-matched samples. These Bayesian group comparisons largely confirmed the mean group difference effects found in frequentist analyses; they also indicated a particularly pronounced group difference in the learning rate for losses when taking the individual posterior variances of parameter estimates into account. The model with the most evidence only retained the difference in these parameters, which is why other parameters have 0 values. Action precision, Reward Sensitivity, and Information Sensitivity values are in log-space. Learning Rate values are in logit-space.