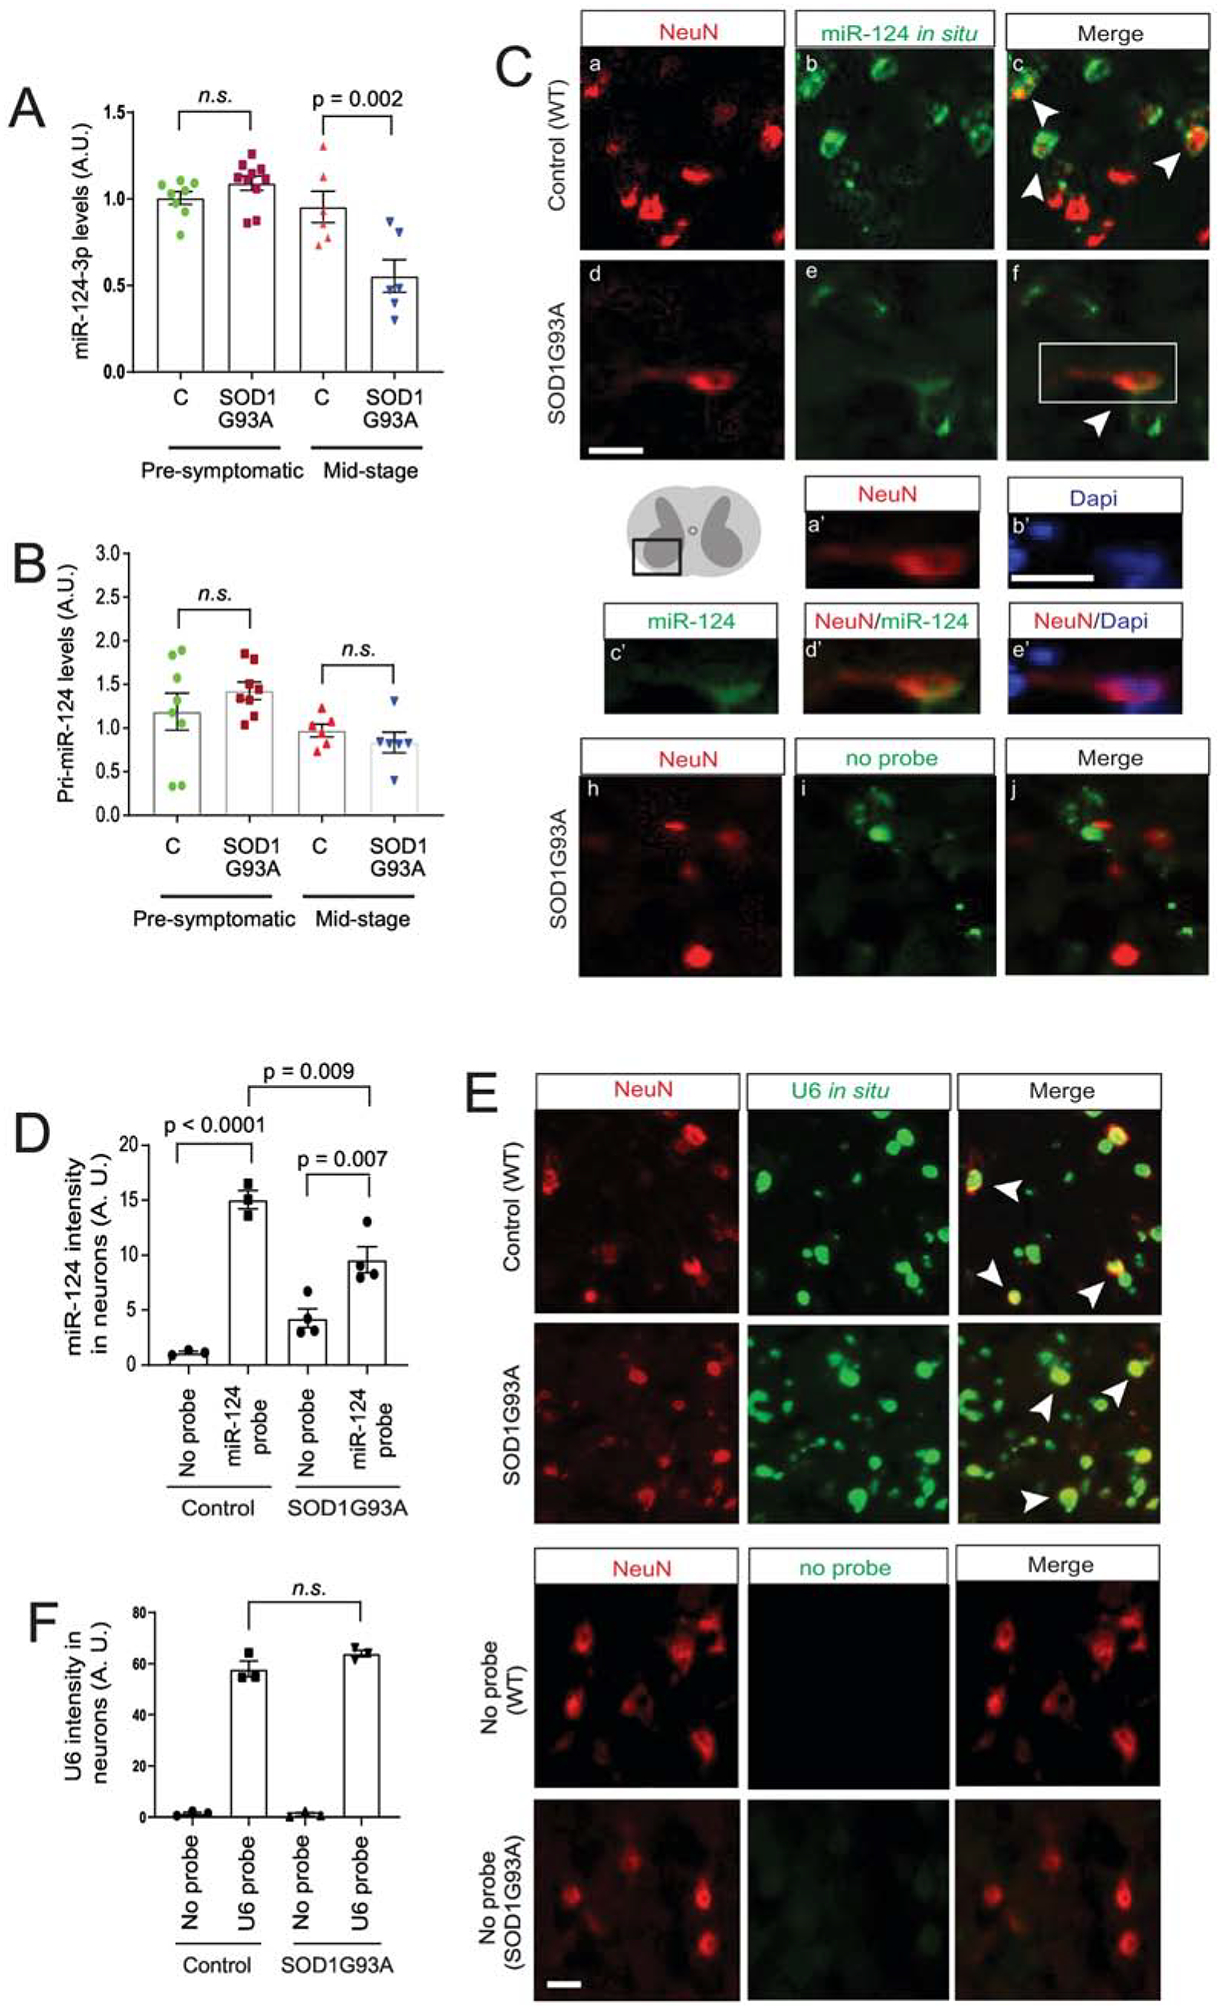
Figure 1. Mature miR-124–3p expression is decreased in SOD1G93A spinal motor neurons.

TaqMan probe-based qPCR detection of mature miR-124–3p (A) and pri-miR-124 expression (B) in lumbar cords isolated from SOD1G93A mice as compared to control wild-type littermates during pre-symptomatic (P60) and mid (P100–110)-stages of disease. N = 6–8 mice/group; p values were determined using the Student’s t-test; C: control wild type mice; miR-124–3p and pri-miR-124 is normalized by U6 snRNA or β-actin, respectively. (C) Representative images of miR-124–3p in situ hybridization and NeuN immunostaining from ventral lumbar cord of control littermates and diseased SOD1G93A mice (P100–110). Scale bar: 20 μm; white arrows: miR-124–3p in situ signals inside NeuN+ neurons. a’-e’, magnified view of NeuN, miR-124–33p, Dapi or merged signals from the box in f; scale bar: 20 μm; (D) Quantification of miR-124–3p (and no-probe control) in situ hybridization fluorescence signals inside NeuN+ neurons from ventral lumbar cord of control littermates and diseased SOD1G93A mice (P100–110). N = 3–4 mice with 15–20 neurons/mouse per group; p values were determined in One-way ANOVA analysis with post-hoc Tukey’s test; Representative images (E) and quantification (F) of U6 RNA in situ hybridization and NeuN immunostaining from ventral lumbar cord of control littermates and diseased SOD1G93A mice (P100–110). N = 3 mice with 15–20 neurons/mouse per group; n.s.; not significant; p values were determined from the Tukey post-hoc test after the one-way ANOVA test.
