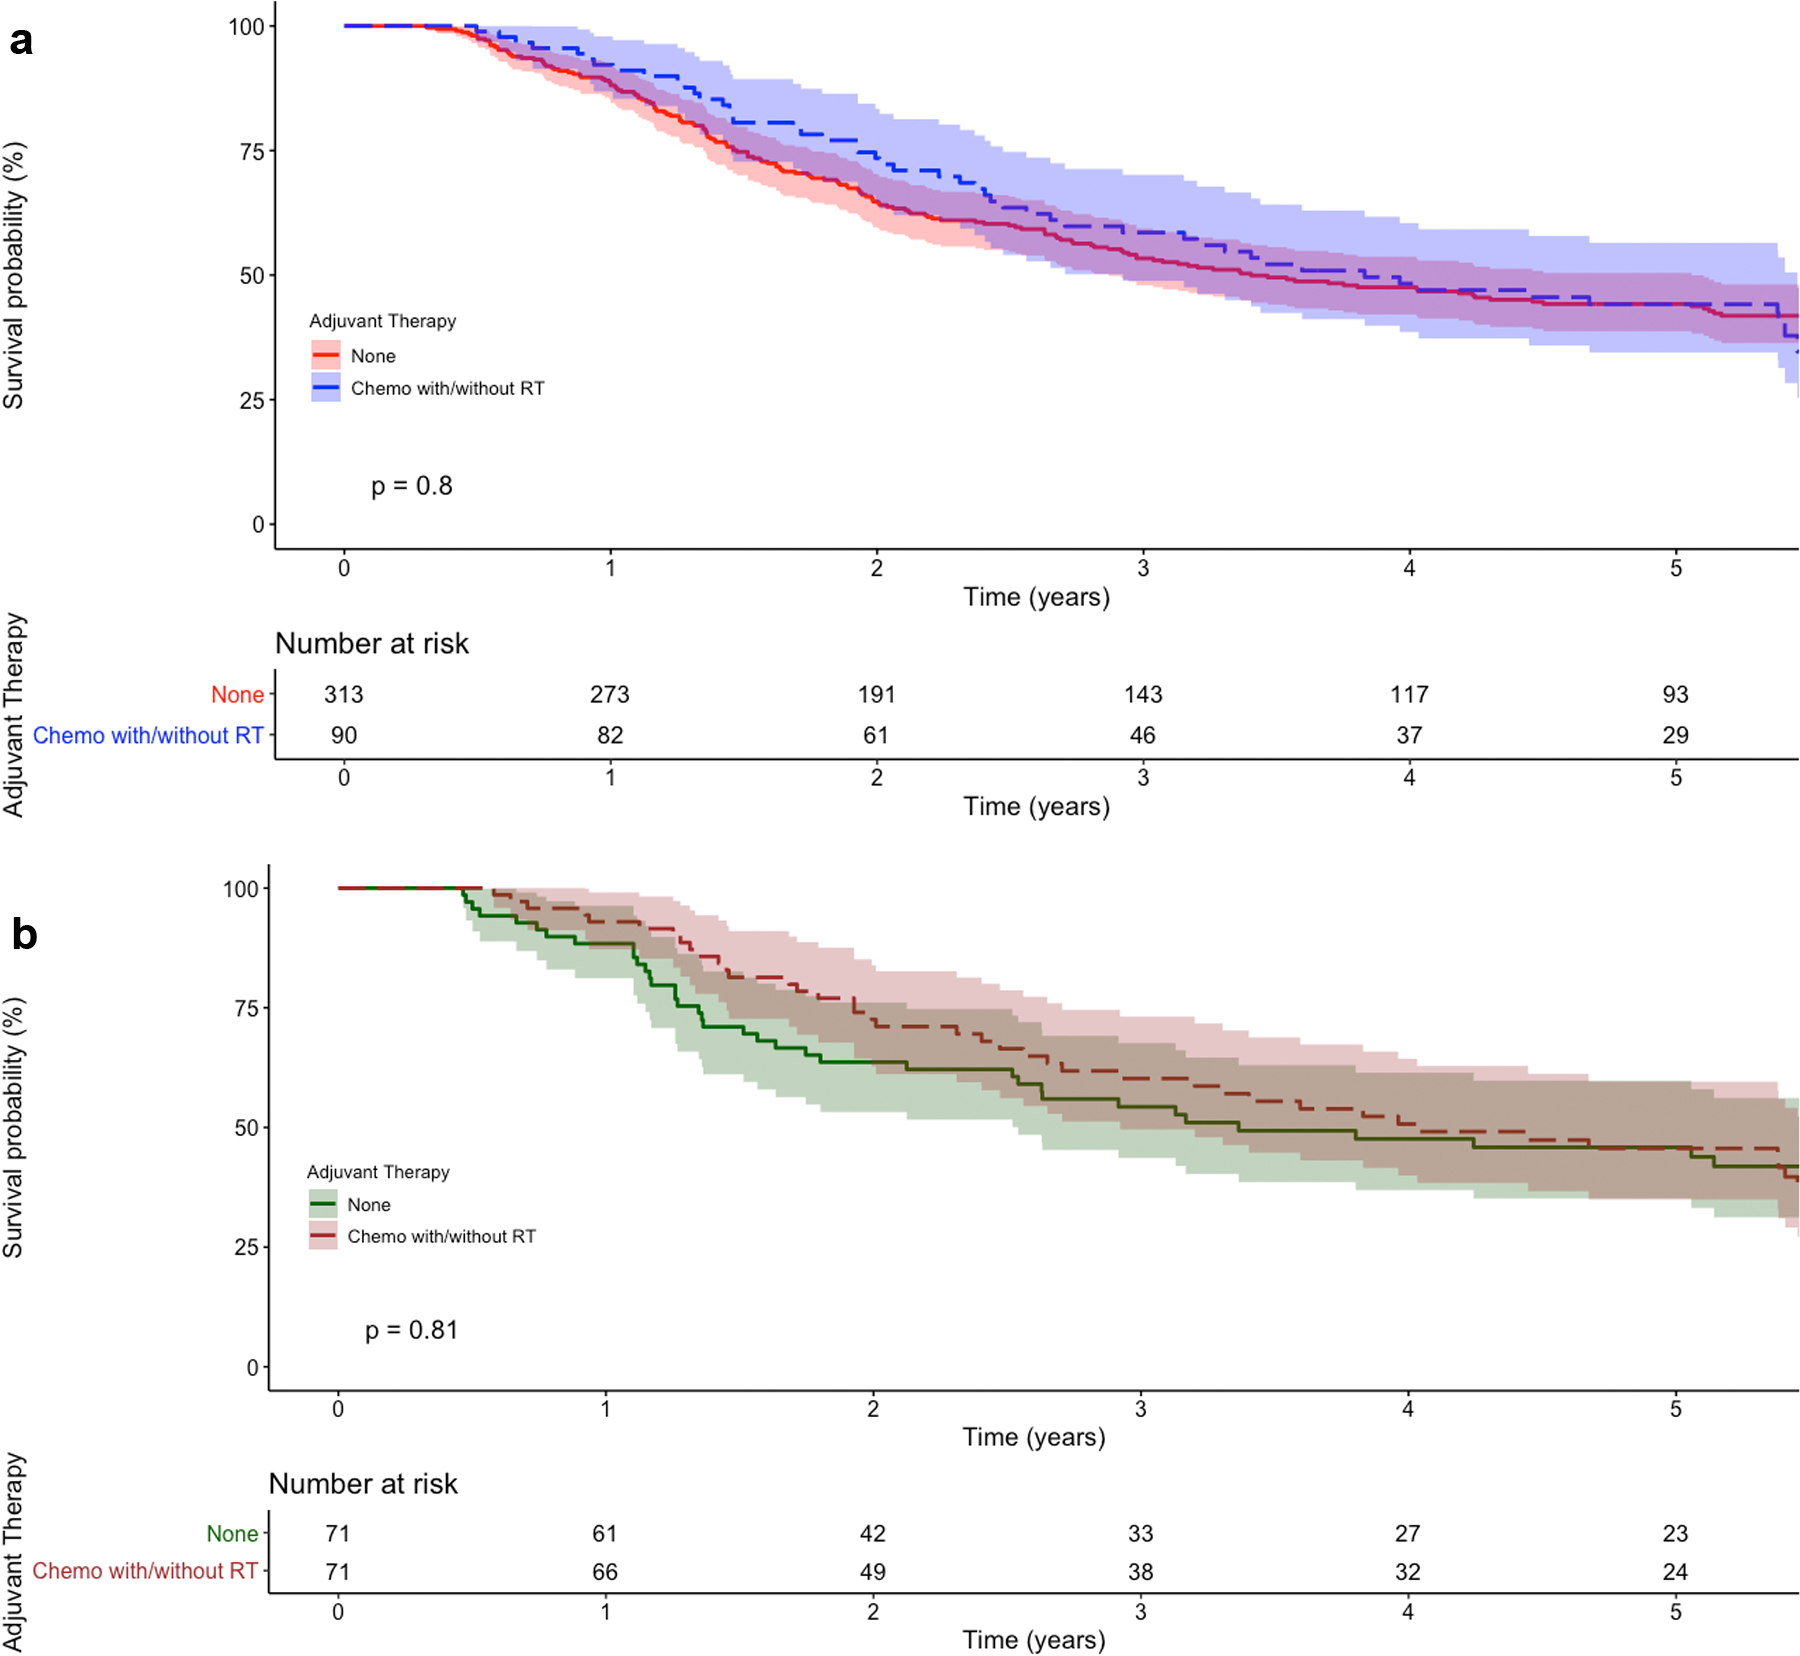
Figure 2.

Kaplan-Meier survival curves for (a) unmatched and (b) propensity score-matched high risk patients with pT2–4N0M0 distal esophageal adenocarcinoma, stratified by type of adjuvant therapy. The p value refers to the log-rank test. Shaded regions represent the 95% confidence interval. Numbers at risk are provided beneath the graph
