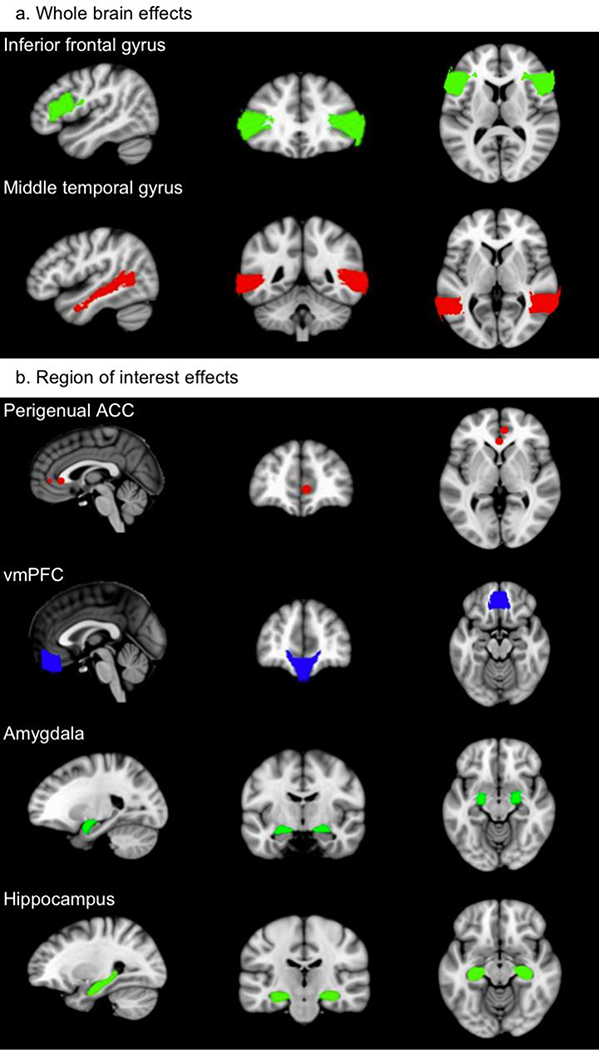
Figure 1.
Illustration of the brain regions that were related to endogenous cortisol levels in at least two studies at either whole-brain (a) or region of interest level (b) during psychological stress in the MRI scanner (regions from Harvard-Oxford atlas, perigenual ACC shown as 5 mm spheres around the peak coordinates from Boehringer et al. (2015) and Akdeniz et al. (2014)).
Note: red represents a positive correlation with cortisol, blue a negative correlation, and green altered function (positive in some studies, negative in others).

