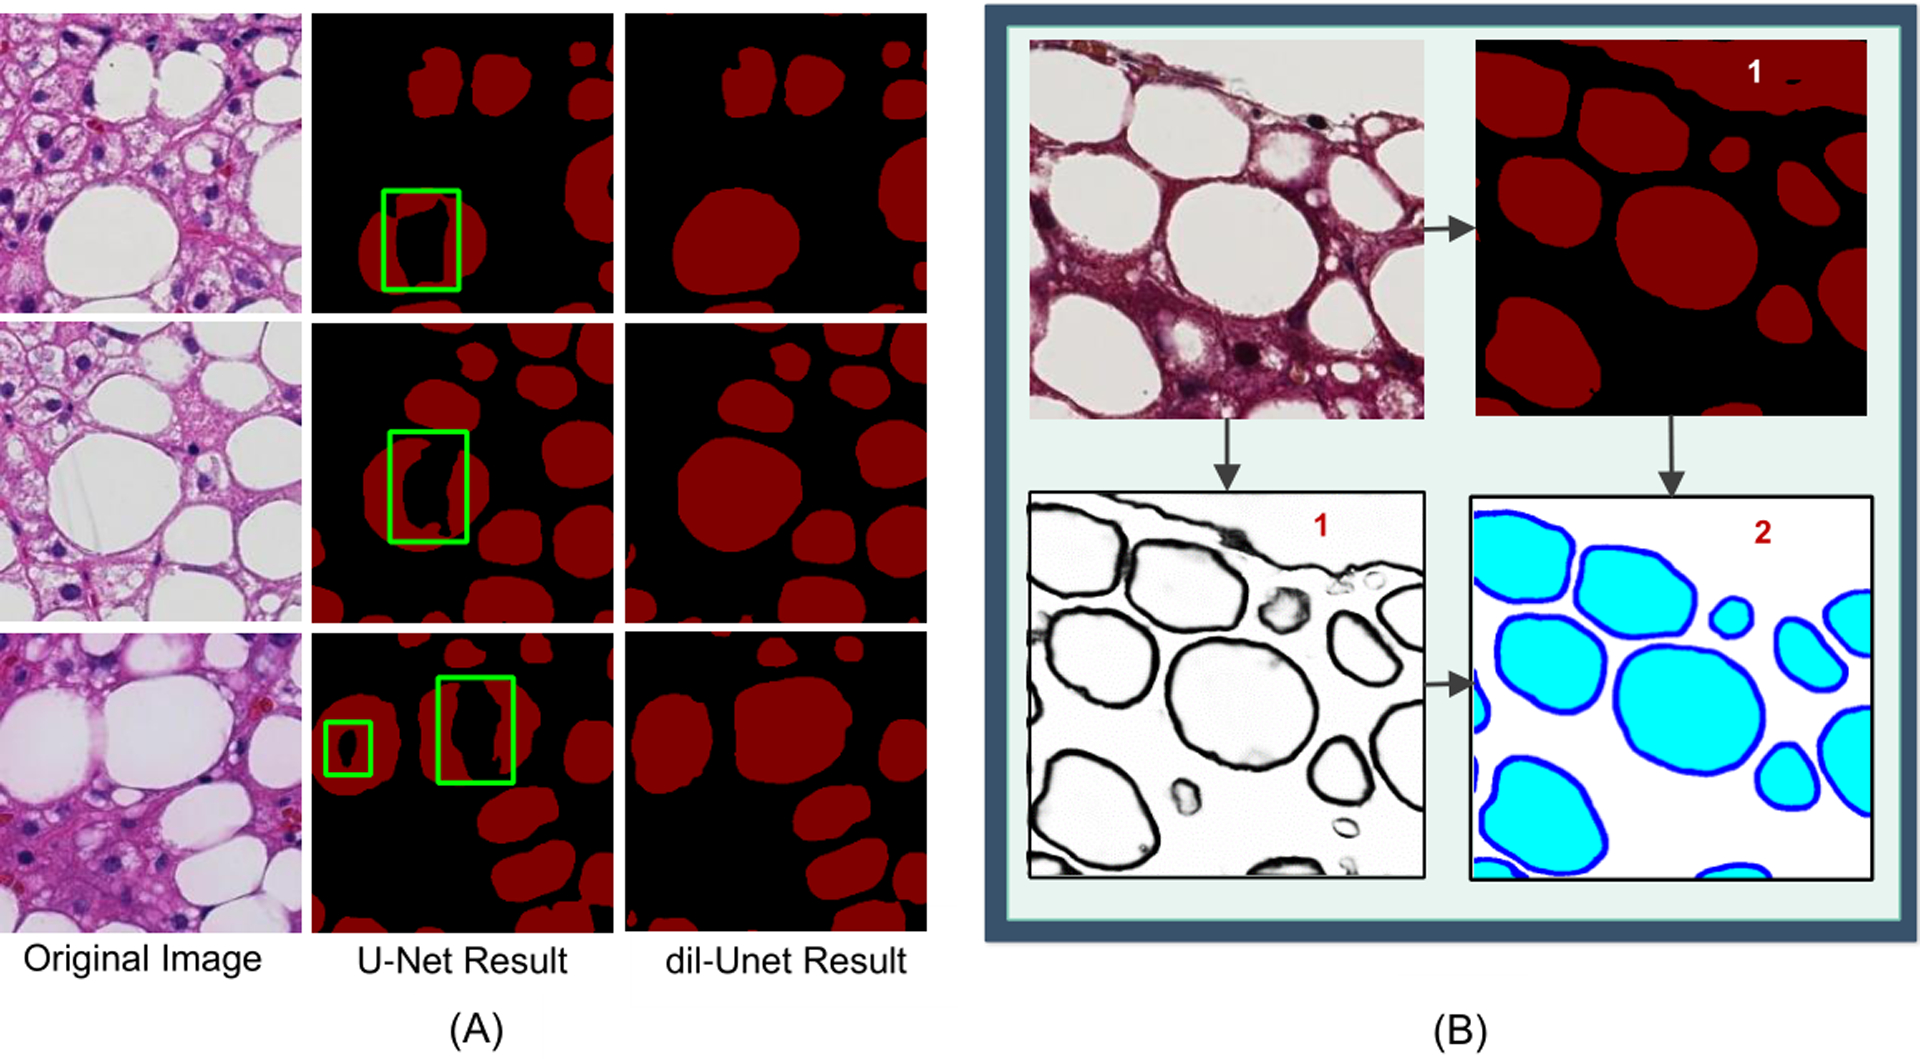
Figure 2.

Comparison of segmentation results. Comparison of segmentation results between dil-Unet and the standard U-Net model (A). Left: original images; Middle: steatosis segmentation by U-Net model; Right: steatosis segmentation by the proposed dil-Unet model. By contrast, dil-Unet can recover steatosis regions with a substantially improved accuracy. Comparison of results from the DELINEATE model (B). Top-Left: input image; Top-Right: output from the region extraction module; Bottom-Left: output from the boundary detection module; and Bottom-Right: final output of the integration module. “1” labels the false positive steatosis region captured by the region prediction module, and “2” labels the corrected steatosis regions by the final integration module.
