
Figure 1.
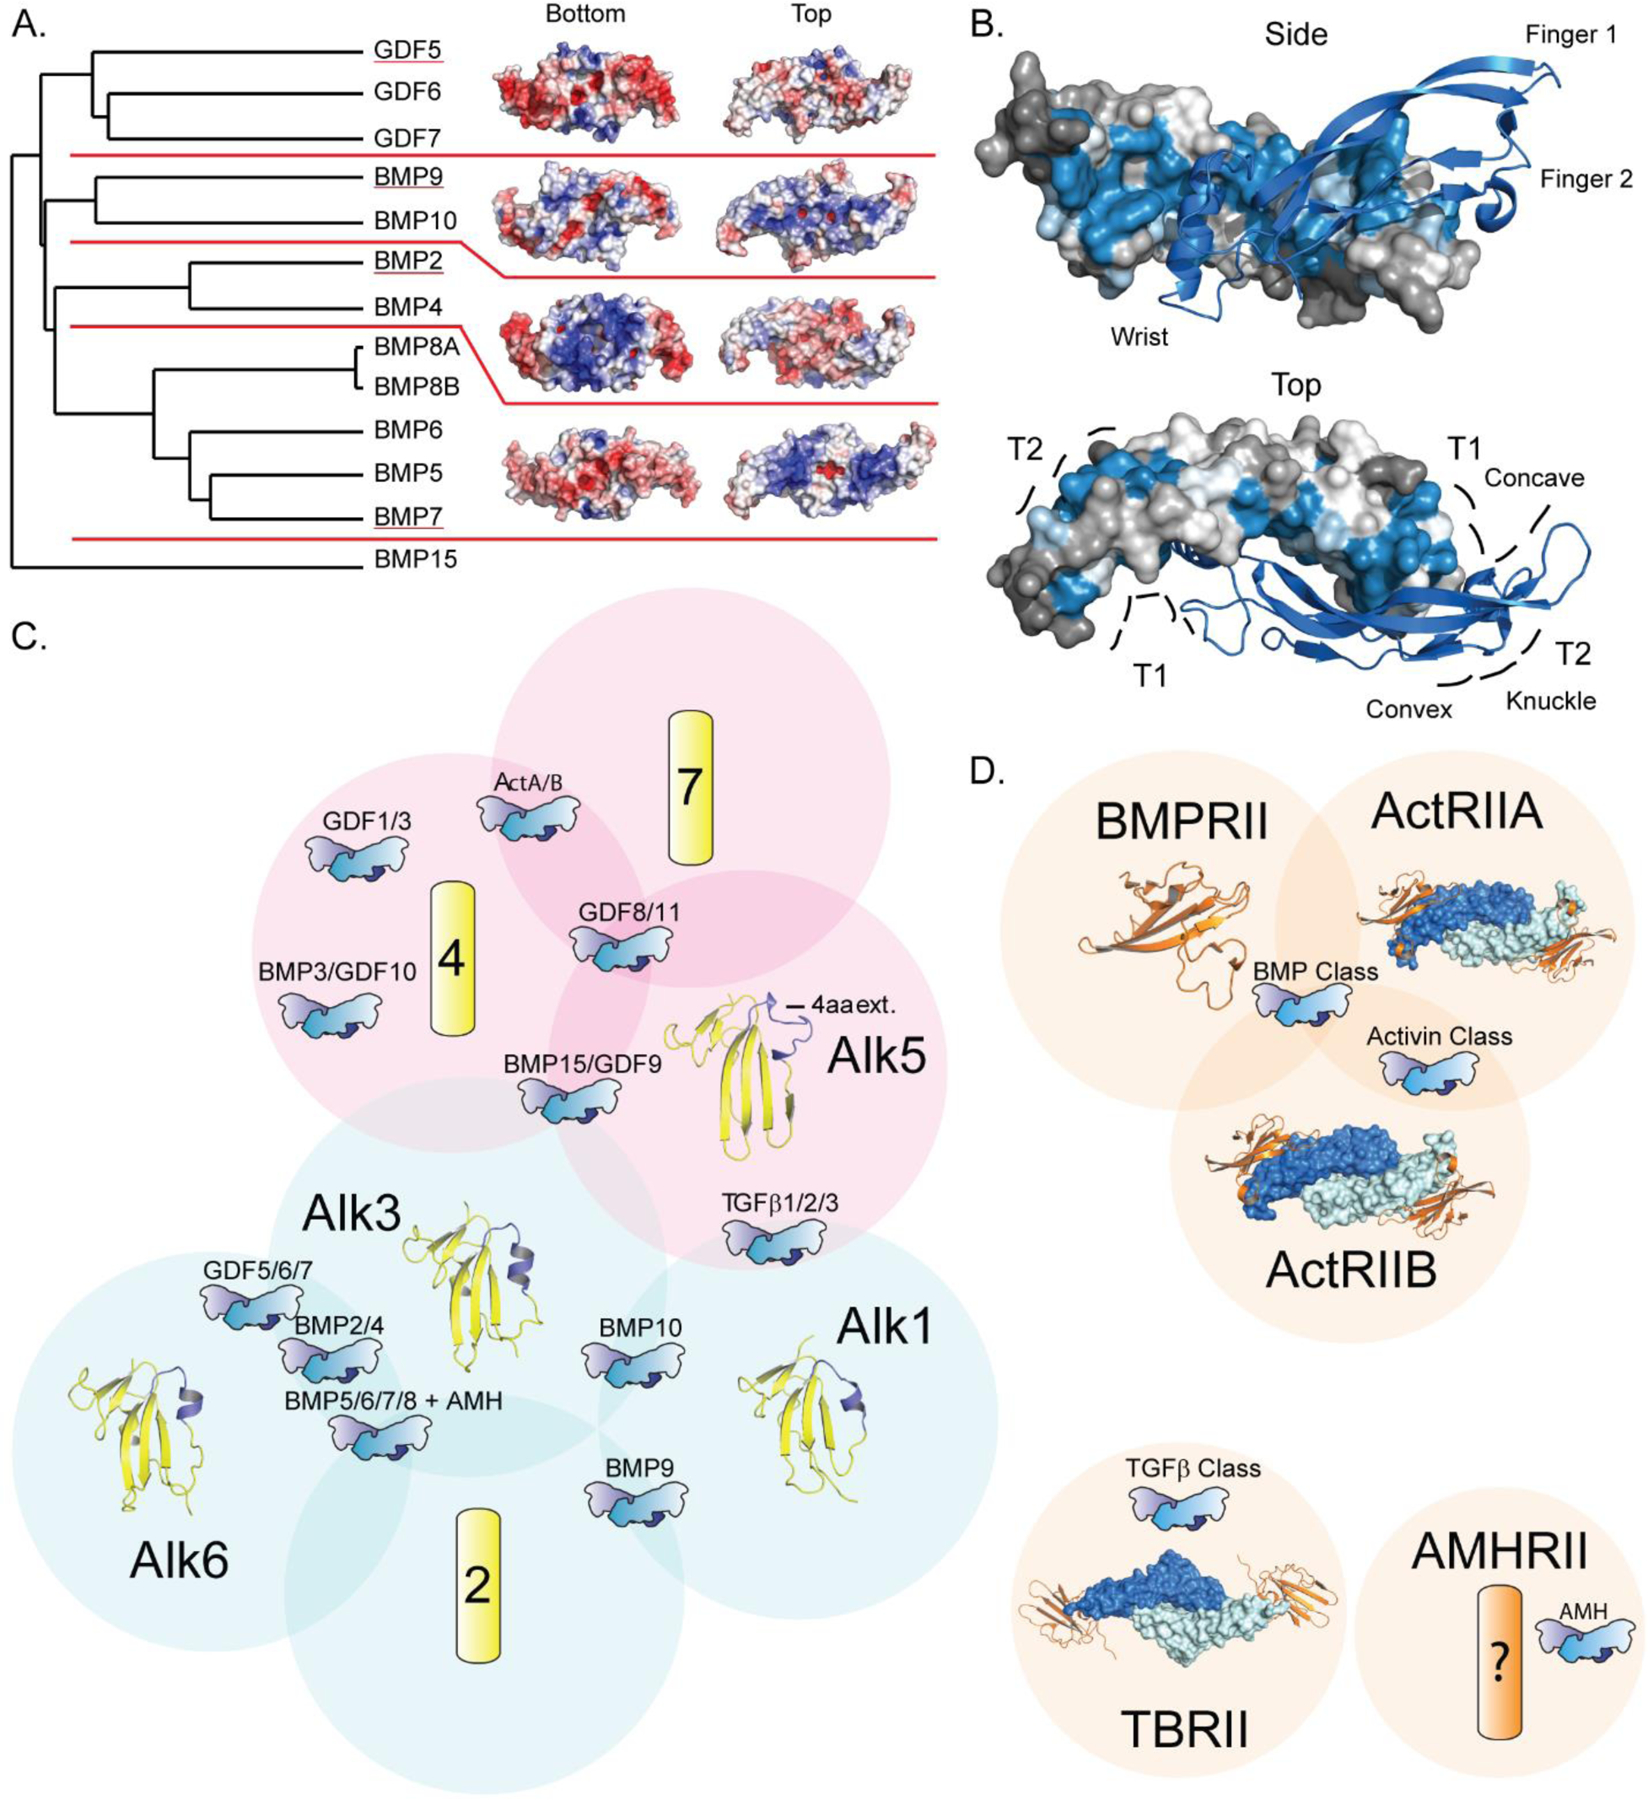
BMP ligand and receptor structures. A) Phylogenetic tree of BMP ligands, separated into subgroups by red lines and electrostatic surfaces of representative structures (underlined) from each available subgroup. Electrostatic surface calculated using APBS Tools (negative potential - colored red, positive potential - colored blue; range from −5 to +5 kbt/ec) [78]. Structure PDB codes: GDF5 (5HK5), BMP9 (4MLP), BMP2 (3BMP), BMP7 (1LXI) [44, 35, 26, 33]. B) BMP ligand residue variance, measured using the ConSurf server, mapped to BMP2 in ribbon (marine) and surface representation (colored based on variance, blue for areas of conservation and gray for areas of high variability) [60–64]. Receptor binding sites for type I (T1) and type II (T2), and structural features are labeled. Structure PDB codes: BMP2 (6OMN) [30]. C) & D) Venn diagram depicting type I (C, yellow) and type II receptor specificity (D, orange) with groups of ligands and structurally unresolved receptors represented schematically. Type I receptor β4-β5 variable loop helix region highlighted in blue. Structure PDB codes: Alk1 (6SF2), Alk3 (2H62), Alk5 (6MAC), Alk6 (3EVS), BMPRII (2HLQ), ActRIIA:BMP2 (2GOO), ActRIIB:BMP9 (4FAO), TBRII:TGFB1 (3KFD) [39, 48, 91, 43, 204, 8, 36, 90].