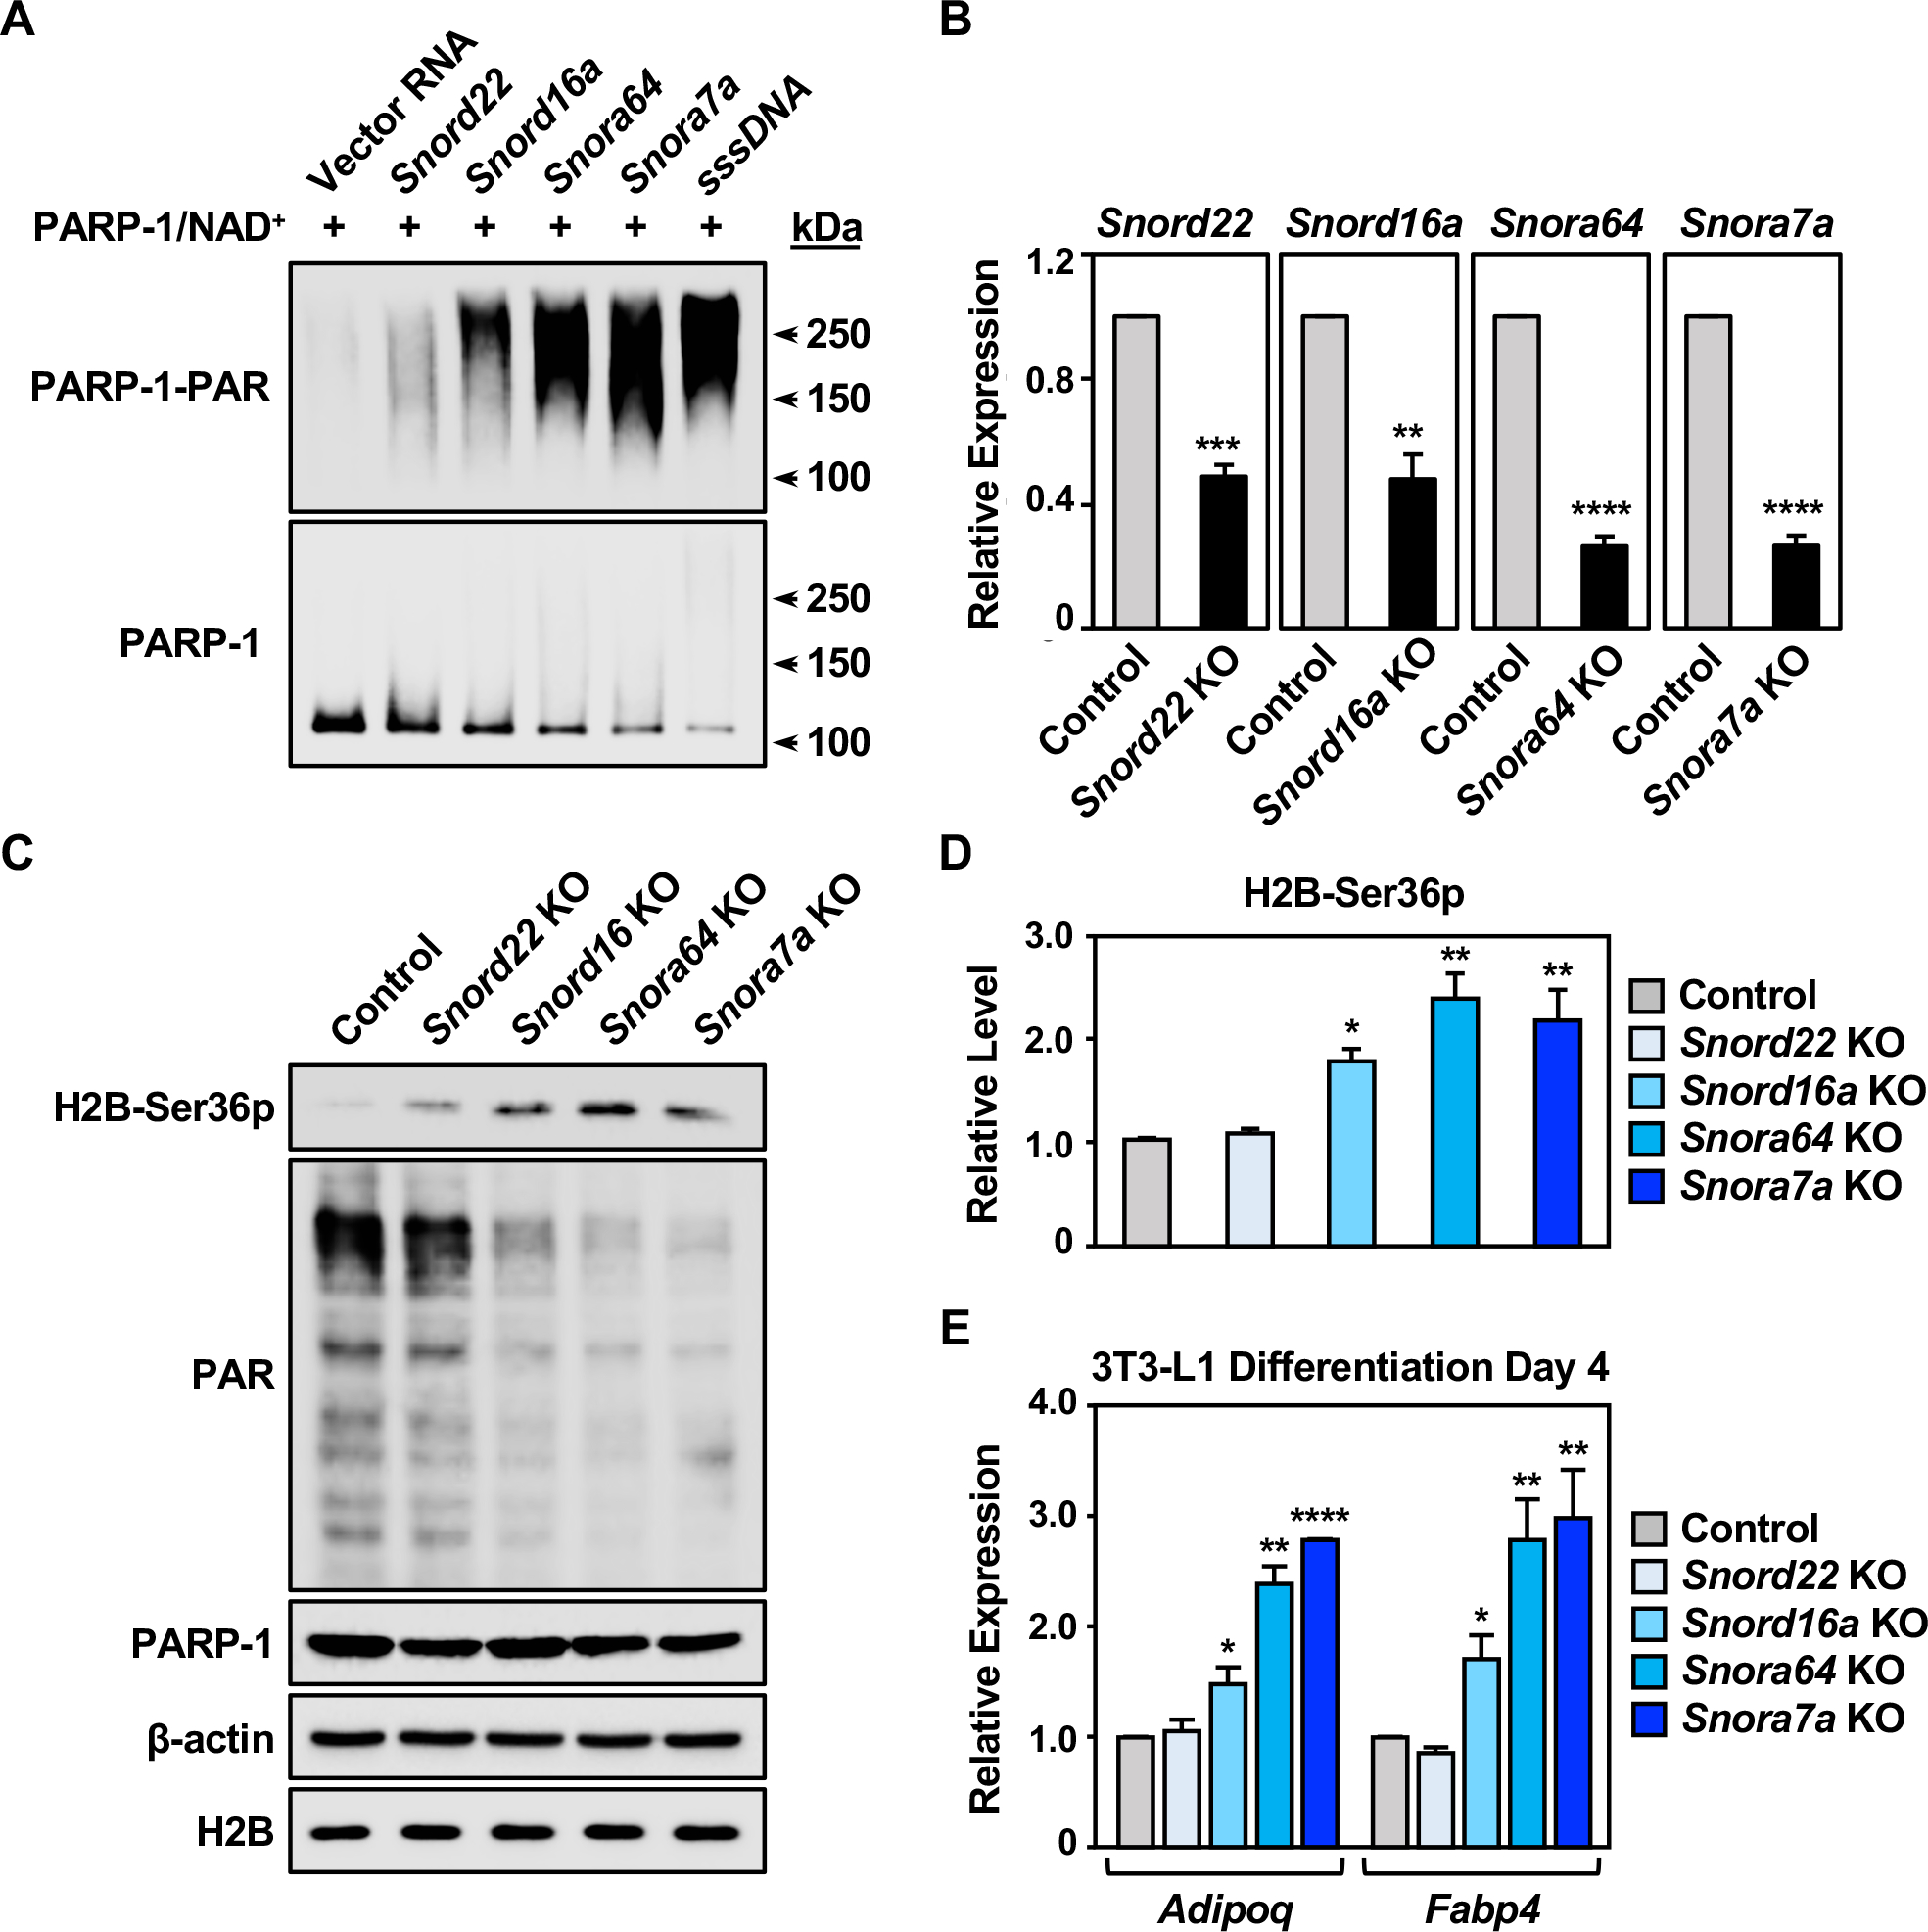
Figure 4. SnoRNAs are physiological activators of PARP-1 during the differentiation of 3T3-L1 cells.

(A) PARP-1 automodification reactions with activation by snoRNAs or sssDNA were analyzed by Western blotting for PAR (upper) and PARP-1 (lower). Molecular weight markers in kDa are shown.
(B) Expression of snoRNAs in 3T3-L1 cells with CRISPR/Cas9-mediated knockout of individual snoRNAs, as determined by RT-qPCR. Each bar represents the mean + SEM (n = 3). Asterisks indicate significant differences from the corresponding Control (Student’s t-test; ** p < 0.01, *** p < 0.001, and **** p < 0.0001).
(C) Western blots showing the levels of H2B-Ser36p, PAR, and PARP-1 in 3T3-L1 cells with CRISPR/Cas9-mediated knockout of individual snoRNAs as indicated. β-actin and H2B were used as loading controls.
(D) Quantification of the H2B-Ser36p levels shown in (C). Each bar represents the mean + SEM (n = 3). Asterisks indicate significant differences from the control (one-way ANOVA followed by Dunnett’s multiple comparisons test; * p<0.05, and ** p < 0.01).
(E) Expression of the adipocyte marker genes Adipoq and Fabp4 in 3T3-L1 cells with CRISPR/Cas9-meditaed knockout of individual snoRNA at differentiation day 4, as determined by RT-qPCR. Each bar represents the mean + SEM (n = 3). Asterisks indicate significant differences from the corresponding control (Student’s t-test; * p < 0.05, ** p < 0.01, and **** p < 0.0001).
[See also Figure S5]
