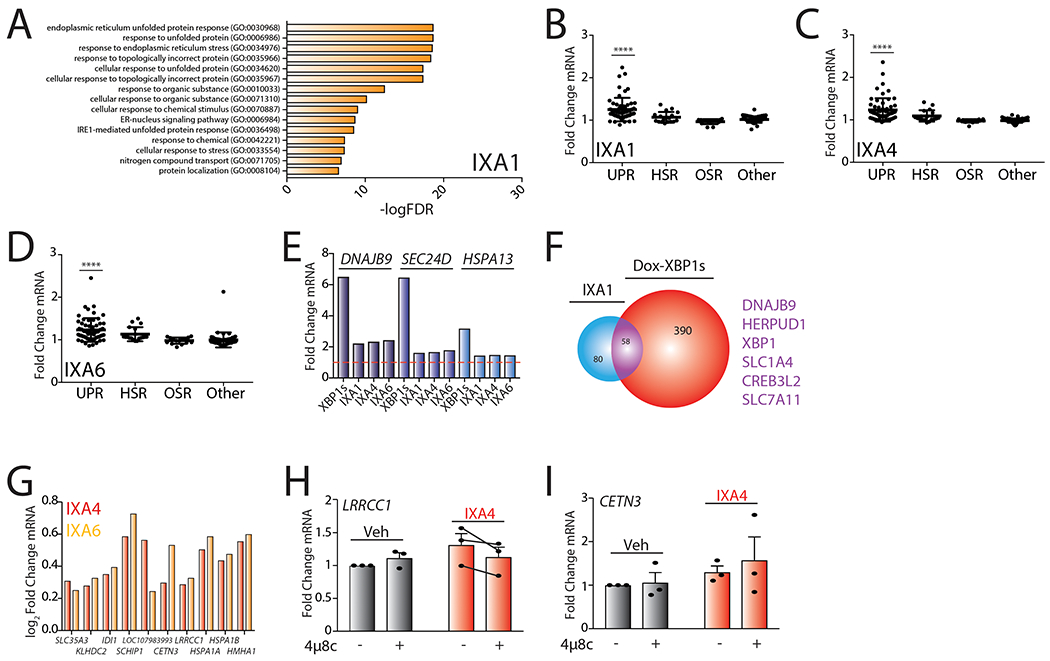
Extended Data Fig. 4.

A. Gene Ontology (GO) analysis of differentially expressed genes from RNAseq for HEK293T cells treated with IXA1 (10 μM, 4hrs). Top 15 entries with lowest FDR are shown. See Supplementary Table 4 for full GO analysis.
B. Graph showing fold change mRNA levels from RNAseq of target genes activated downstream of the UPR, HSR, OSR, and other stress signaling pathways in HEK293T cells treated with IXA1 (10 μM) for 4 hrs. The composition of these genesets is shown in Source Data Table 3. P-values were calculated using one-way ANOVA compared to “Other”. ****p<0.0001.
C. Graph showing fold change mRNA levels from RNAseq of target genes activated downstream of the UPR, HSR, OSR, and other stress signaling pathways in HEK293T cells treated with IXA4 (10μM) for 4 hrs. The composition of these genesets is shown in Source Data Table 3. P-values were calculated using one-way ANOVA compared to “Other”. ****p<0.0001.
D. Graph showing fold change mRNA levels from RNAseq of target genes activated downstream of the UPR, HSR, OSR, and other stress signaling pathways in HEK293T cells treated with IXA6 (10μM) for 4 hrs. The composition of these genesets is shown in Source Data Table 3. P-values were calculated using one-way ANOVA compared to “Other”. ****p<0.0001.
E. Bar graph showing fold change mRNA levels of the IRE1/XBP1s targets DNAJB9, SEC24D, and HSPA13 from RNAseq of HEK293DAX cells expressing dox-inducible XBP1s treated with dox (1 μg/mL) for 4 hr or HEK293T cells treated with compounds IXA1, IXA4, or IXA6 (10 μM) for 4 hrs.
F. Venn diagram of genes upregulated >1.2 fold (adjusted p-value <0.05) in HEK293T cells treated with compound IXA1 (10 μM) for 4 hrs in comparison to genes induced >1.2 fold (adjusted p-value < 0.05) in HEK293DAX cells treated with doxycycline (1 μg/mL) for 4 hrs. Genes listed in purple are top overlapping targets between conditions.
G. Graph showing log2Fold Change mRNA levels from RNAseq of the 10 non-overlapping genes activated in cells treated with IXA4 (10μM) compared to dox-inducible XBP1s. Log2Fold change mRNA levels of these genes in cells treated with IXA6 (10μM) are also included.
H. Graph showing qPCR of the LRRCC1 gene in 293T cells treated with IXA4 (10 μM) in the presence or absence of 4μ8c (64μM) for 4 hrs. Error bars show SE for n= 3.
I. Graph showing qPCR of the CETN3 gene in 293T cells treated with IXA4 (10 μM) in the presence or absence of 4μ8c (64μM) for 4 hrs. Error bars show SE for n= 3.
