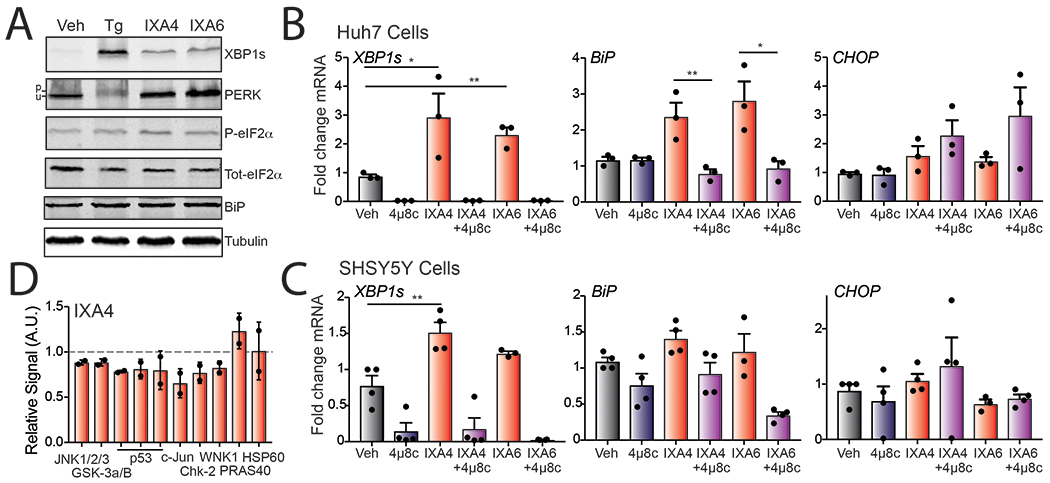
Extended Data Fig. 6.

A. Representative immunoblots of XBP1s, PERK, eIF2α, and BiP in lysates prepared from HEK293T cells treated with vehicle, thapsigargin (1μM), IXA4 (10μM), or IXA6 (10 μM) for 4 hrs.
B. Graph showing qPCR of the XBP1 target gene DNAJB9, ATF6 target gene BiP, and PERK target gene CHOP in Huh-7 cells treated with IXA4 (10 μM) or IXA6 (10μM) in the presence or absence of 4μ8c (64μM) for 4 hrs. Error bars show SE for n=3 replicates. Statistics calculated from one-tailed Student’s t-test. *p<0.05, **p<0.01.
C. Graph showing qPCR of the XBP1 target gene DNAJB9, ATF6 target gene BiP, and PERK target gene CHOP in SHSY5Y cells treated with IXA4 (10 μM) or IXA6 (10μM) in the presence or absence of 4μ8c (64μM) for 4 hrs. Error bars show SE for n=4 replicates. Statistics calculated from one-tailed Student’s t-test. *p<0.05, **p<0.01.
D. Graph showing relative signal of phosphorylated target proteins by phosphokinase array dot immunoblotting in HEK293T cells treated with IXA4 (10μM) for 4 hrs. Error bars show SD for n=2.
