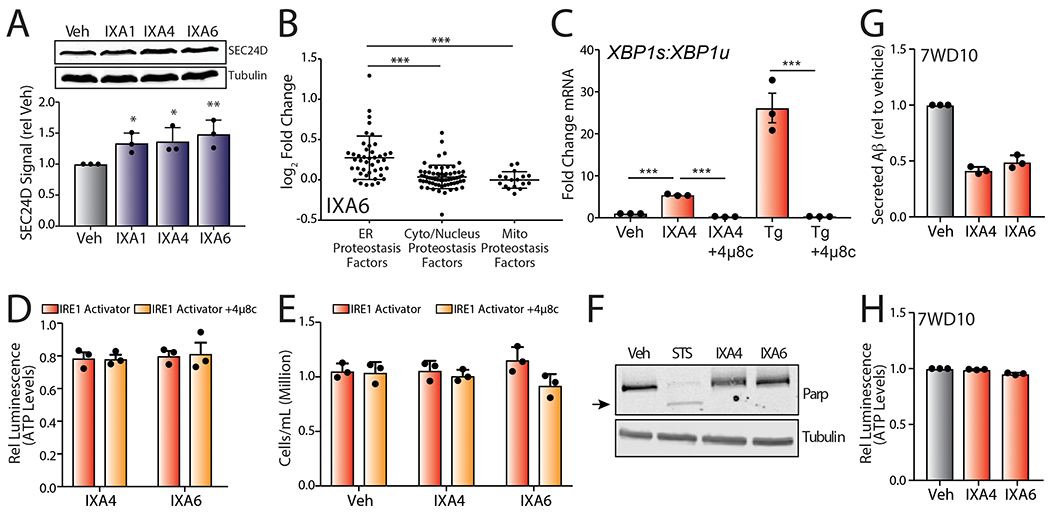
Extended Data Fig. 7.

A. Representative immunoblots and quantification of SEC24D in lysates prepared from HEK293T cells treated with vehicle, IXA1, IXA4, or IXA6 (10 μM, 18 hrs). Error bars show SD for n= 3 replicates. P-values were calculated using one-tailed Student’s t-test. *p<0.05, **p<0.01.
B. Plot of log2 Fold Change mRNA levels from RNAseq in cells treated with IXA6 (10μM, 4 hrs) of proteostasis factors found in the ER, cytosol/nucleus, or mitochondria. The composition of these proteostasis genesets is shown in Source Data Table 3.
C. Graph showing the Fold change mRNA ratio of Xbp1s:Xbp1u by qPCR in CHO7PA2 cells treated with IXA4 (10 μM) or thapsigargin (1μM) in the presence or absence of 4μ8c (64μM) for 4 hrs. Error bars show SE for n=3 replicates. Statistics calculated from one-tailed Student’s t-test. *p<0.05, **p<0.01.
D. Graph showing relative CellTiterGlo luminescence from CHO7PA2 cells treated with IRE1/XBP1s activators IXA4, or IXA6 (10 μM) in the presence or absence of 4μ8c (32 μM). Cells were treated for 18 hrs, media was then replaced and conditioned in the presence of treatments for 24 hrs before measuring ATP levels. Luminescence signal was normalized to that observed in untreated controls. Error bars represent SE for n = 3 replicates.
E. Graph showing cell counts (106cells/mL) of CHO7PA2 cells treated with IXA4 or IXA6 (10 μM) in the presence or absence of 4μ8c (64 μM) for 24 hrs.
F. Immunoblot of mutant PARP in lysates collected from CHO7PA2 cells treated with IXA4 or IXA6 (10 μM) or staurosporine (1 μM) for 24 hrs.
G. Graph showing relative signal from ELISA of secreted Aβ peptide from conditioned media prepared on CHO7WD10 cells treated with IXA4 or IXA6 (10 μM). Cells were pretreated for 18 hrs with compounds. Media was then replaced and conditioned in the presence of compounds for 24 hrs before harvesting the media for ELISA. Secreted Aβ was normalized to that observed in untreated controls. Error bars represent SE for n = 3 replicates.
H. Graph showing relative CellTiterGlo luminescence from CHO7WD10 cells treated with IRE1/XBP1s activators IXA4 or IXA6 (10 μM). Cells were treated for 18 hrs, media was then replaced and conditioned in the presence of treatments for 24 hrs before measuring ATP levels. Luminescence signal was normalized to that observed in untreated controls. Error bars represent SE for n = 3 replicates.
