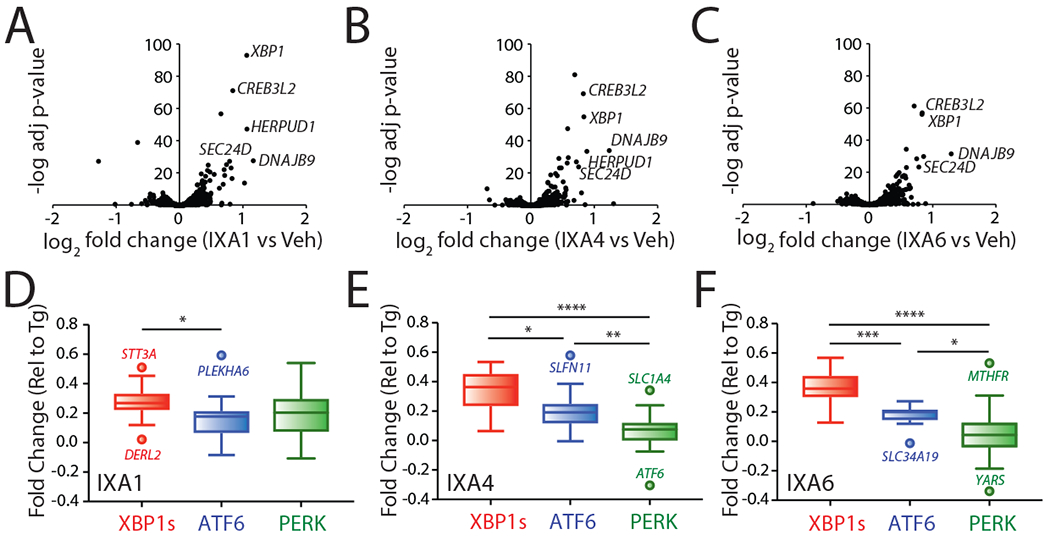
Figure 3. Transcriptional profiling of compounds IXA1, IXA4, and IXA6 shows preferential induction of IRE1/XBP1s target genes.

A. Volcano plots from whole-transcriptome RNAseq showing negative log transformed adjusted p-values for gene expression (y-axis) versus log2 transformed fold change (x-axis) in HEK293T cells treated for 4 hrs with IXA1 (10 μM).
B. Volcano plots from whole-transcriptome RNAseq showing negative log transformed adjusted p-values for gene expression (y-axis) versus log2 transformed fold change (x-axis) in HEK293T cells treated for 4 hrs with IXA4 (10 μM).
C. Volcano plots from whole-transcriptome RNAseq showing negative log transformed adjusted p-values for gene expression (y-axis) versus log2 transformed fold change (x-axis) in HEK293T cells treated for 4 hrs with IXA6 (10 μM).
D. Plots showing fold change values from whole-transcriptome RNAseq of target genes regulated downstream of the IRE1/XBP1s (red), ATF6 (blue), or PERK (green) signaling arms of the UPR expressed as fold change relative to Tg treatment (1 μM, 4hr) in HEK293T cells treated with IXA1 (10 μM, 4hr). Center line reflects median, box limits reflect upper and lower quartiles, whiskers reflect 1.5x IQ range, and points reflect outliers as calculated by Tukey method. The composition of these genesets is shown in Source Data Table 3.
E. Plots showing fold change values from whole-transcriptome RNAseq of target genes regulated downstream of the IRE1/XBP1s (red), ATF6 (blue), or PERK (green) signaling arms of the UPR expressed as fold change relative to Tg treatment (1 μM, 4hr) in HEK293T cells treated with IXA4 (10 μM, 4hr). Center line reflects median, box limits reflect upper and lower quartiles, whiskers reflect 1.5x IQ range, and points reflect outliers as calculated by Tukey method. The composition of these genesets is shown in Source Data Table 3.
F. Plots showing fold change values from whole-transcriptome RNAseq of target genes regulated downstream of the IRE1/XBP1s (red), ATF6 (blue), or PERK (green) signaling arms of the UPR expressed as fold change relative to Tg treatment (1 μM, 4hr) in HEK293T cells treated with IXA6 (10 μM, 4hr). Center line reflects median, box limits reflect upper and lower quartiles, whiskers reflect 1.5x IQ range, and points reflect outliers as calculated by Tukey method. The composition of these genesets is shown in Source Data Table 3.
