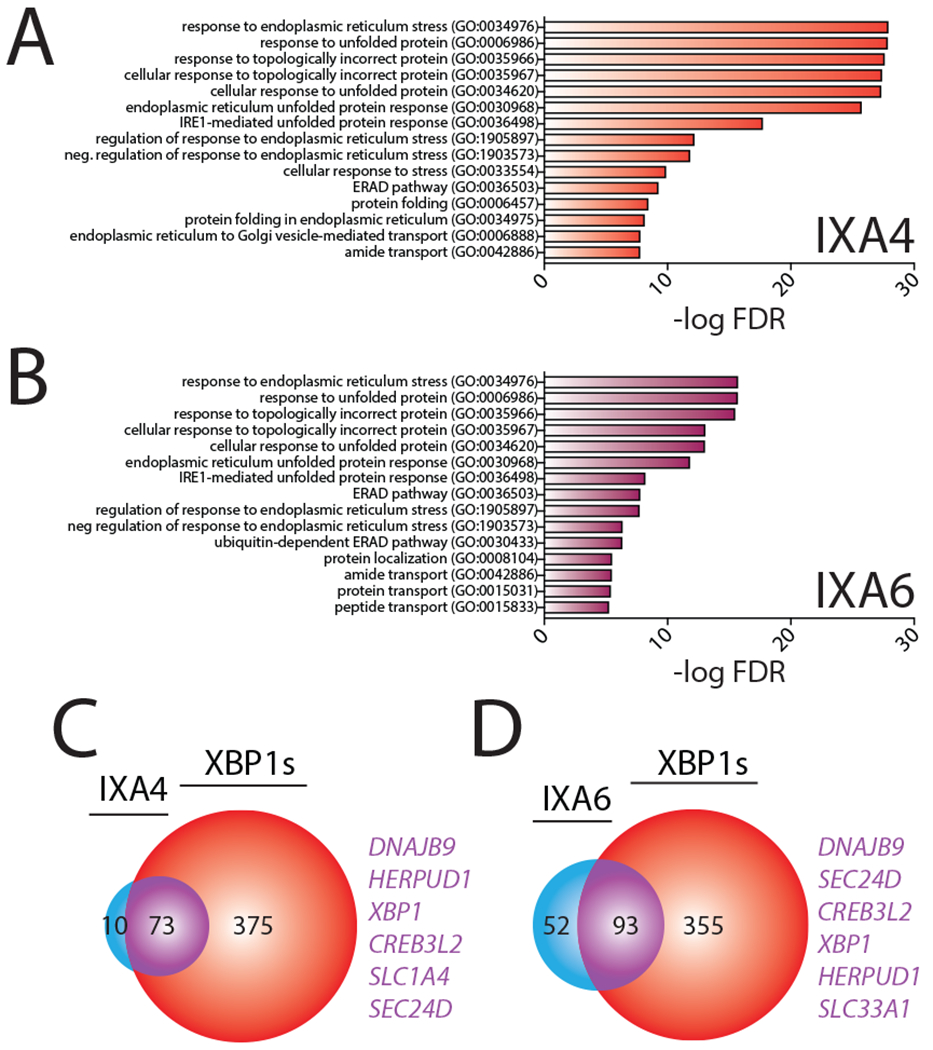
Figure 4. Compounds IXA4 and IXA6 show selectivity for IRE1/XBP1s-dependent ER proteostasis remodeling.

A. Gene Ontology (GO) analysis of differentially expressed genes from RNAseq for HEK293T cells treated with IXA4 (10 μM, 4hr). Top 15 entries with lowest FDR are shown. See Supplementary Table 4 for full GO analysis.
B. Gene Ontology (GO) analysis of differentially expressed genes from RNAseq for HEK293T cells treated with IXA6 (10 μM, 4hr). Top 15 entries with lowest FDR are shown. See Supplementary Table 4 for full GO analysis.
C. Venn diagram of genes upregulated >1.2 fold (adjusted p-value <0.05) in HEK293T cells treated with compound IXA4 (10 μM) for 4 hrs in comparison to genes induced >1.2 fold (adjusted p-value < 0.05) in HEK293DAX cells treated with doxycycline (1 μg/mL) for 4 hrs. Genes listed in purple are top overlapping targets between conditions.
D. Venn diagram of genes upregulated >1.2 fold (adjusted p-value <0.05) in HEK293T cells treated with compound IXA6 (10 μM) for 4 hrs in comparison to genes induced >1.2 fold (adjusted p-value < 0.05) in HEK293DAX cells treated with doxycycline (1 μg/mL) for 4 hrs. Genes listed in purple are top overlapping targets between conditions.
