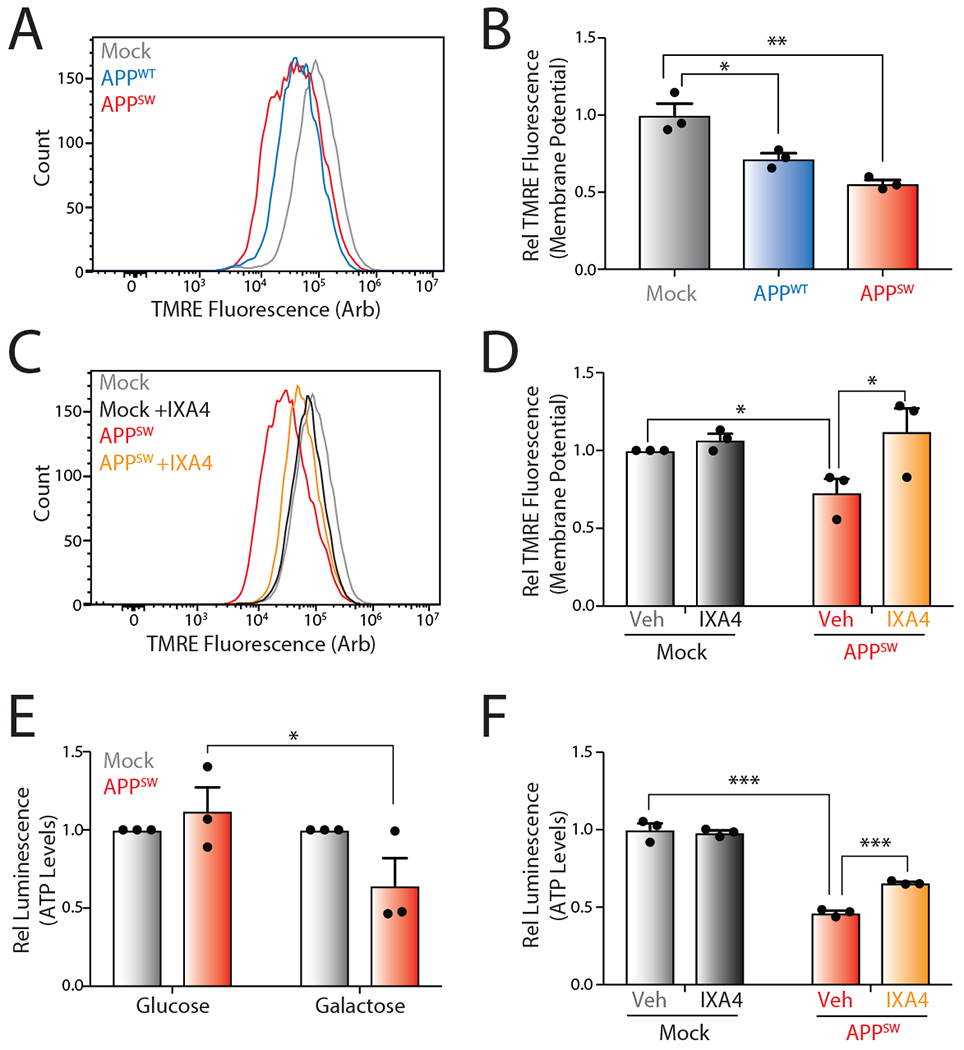
Figure 6. The IRE1/XBP1s activator IXA4 rescues mitochondrial defects in SH-SY5Y cells expressing disease-relevant APP mutants.

D. Representative histograms showing TMRE staining of SHSY5Y cells transiently expressing empty vector (Mock), wild-type APP (APPWT), or Swedish mutant APP (APPSW).
E. Quantification of TMRE staining from panel A. TMRE normalized to geometric mean from cells transiently expressing empty vector (Mock). Error bars represent SD for n = 3 replicates. P-values were calculated from one-tailed Student’s t-test. *p<0.05, **p<0.01.
F. Representative histograms showing TMRE staining of SHSY5Y cells transiently expressing empty vector (Mock) or APPSW in the presence or absence of IXA4 (10 μM) for 72 hrs.
G. Quantification of TMRE staining from panel C. TMRE normalized to geometric mean from cells transiently expressing empty vector (Mock). Error bars represent SE for n = 3 replicates. P-values were calculated from one-tailed Student’s t-test. *p<0.05.
H. Graph showing relative ATP levels measured by CellTiterGlo luminescence in SHSY5Y cells transiently expressing empty vector or APPSW cultured in either normal high glucose media or glucose-free media supplemented with galactose for 72 hrs. Luminescence signal was normalized to that observed in cells transiently expressing empty vector (Mock) cultured in glucose- or galactose-containing media. Error bars represent SE for n = 3 replicates. P-values were calculated from one-tailed Student’s t-test. *p<0.05
I. Graph showing relative ATP levels measured by CellTiterGlo luminescence in SHSY5Y cells transiently expressing empty vector (Mock) or APPSW cultured in galactose media for 72 hrs in the presence or absence of IXA4 (10 μM). Luminescence signal was normalized to that observed in cells transiently expressing empty vector (Mock) incubated in the absence of IXA4. Error bars represent SD for n = 3 replicates. P-values were calculated from one-tailed Student’s t-test. ***p<0.001.
