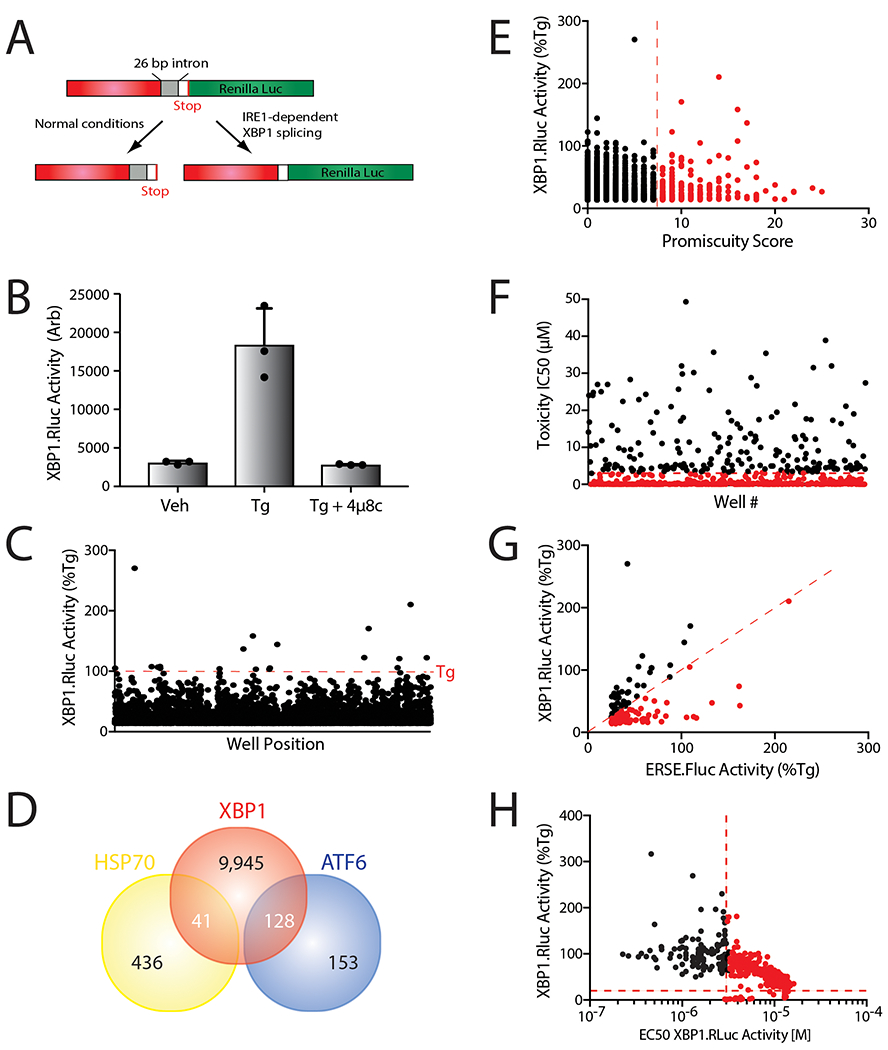
Extended Data Fig. 1.

A. Schematic of the XBP1-Renilla luciferase (XBP1-RLuc) splicing reporter used in our high-throughput screen to identify small molecule activators of IRE1/XBP1s signaling.
B. Graph showing XBP1-RLuc splicing reporter activation in HEK293TREX cells incubated with Tg (500 nM) in the presence or absence of 4μ8c (64 μM) for 16 hrs. Error bars show SD for n=3 replicates.
C. Plot showing XBP1-RLuc activation in HEK293TREX cells stably expressing the XBP1-RLuc reporter treated with the 10,114 small molecules (6 μM; 18 hrs) identified as hits in the primary screen. Luminescence is shown as % signal relative to treatment with Tg (500 nM; 18 hrs).
D. Venn diagram of overlap of compounds identified to activate the IRE1-dependent XBP1-RLuc splicing reporter, the ATF6-selective ERSE-FLuc reporter, or the HSF1-dependent HSP70-FLuc reporter via high-throughput screening.
E. Plot showing XBP1-RLuc activation HEK293TREX cells (% signal compared to that observed with 500 nM Tg, 18 hrs) versus promiscuity score for our top 638 compounds identified by HTS. The promiscuity score reports on the number of assays performed at the TSRI-FL Screening Center where each compound was identified as a positive hit.
F. Plot showing IC50 for toxicity as measured by CellTiterGlo luminescence calculated from titration screening of 638 hit compounds. The dashed red lines indicates IC50 = 3 μM.
G. Plot showing IRE1-dependent XBP1-RLuc activation versus ATF6-selective ERSE-Fluc activation in HEK293TREX cells (% signal compared to that observed with 500nM Tg, 18 hrs) for the subset of our top 638 compounds that were also identified to activate the ATF6-selective ERSE-FLuc reporter. The dashed red line indicates equal XBP1s-Rluc and ERSE-Fluc activation.
H. Plot showing XBP1-RLuc activation in HEK293TREX cells (% signal compared to that observed with 500nM Tg, 18 hrs) versus EC50 of XBP1-RLuc activation in HEK293TREX cells calculated from titration screening of hit 638 compounds. The dashed red lines indicates 20% Rluc activation and Rluc EC50 = 3μM.
