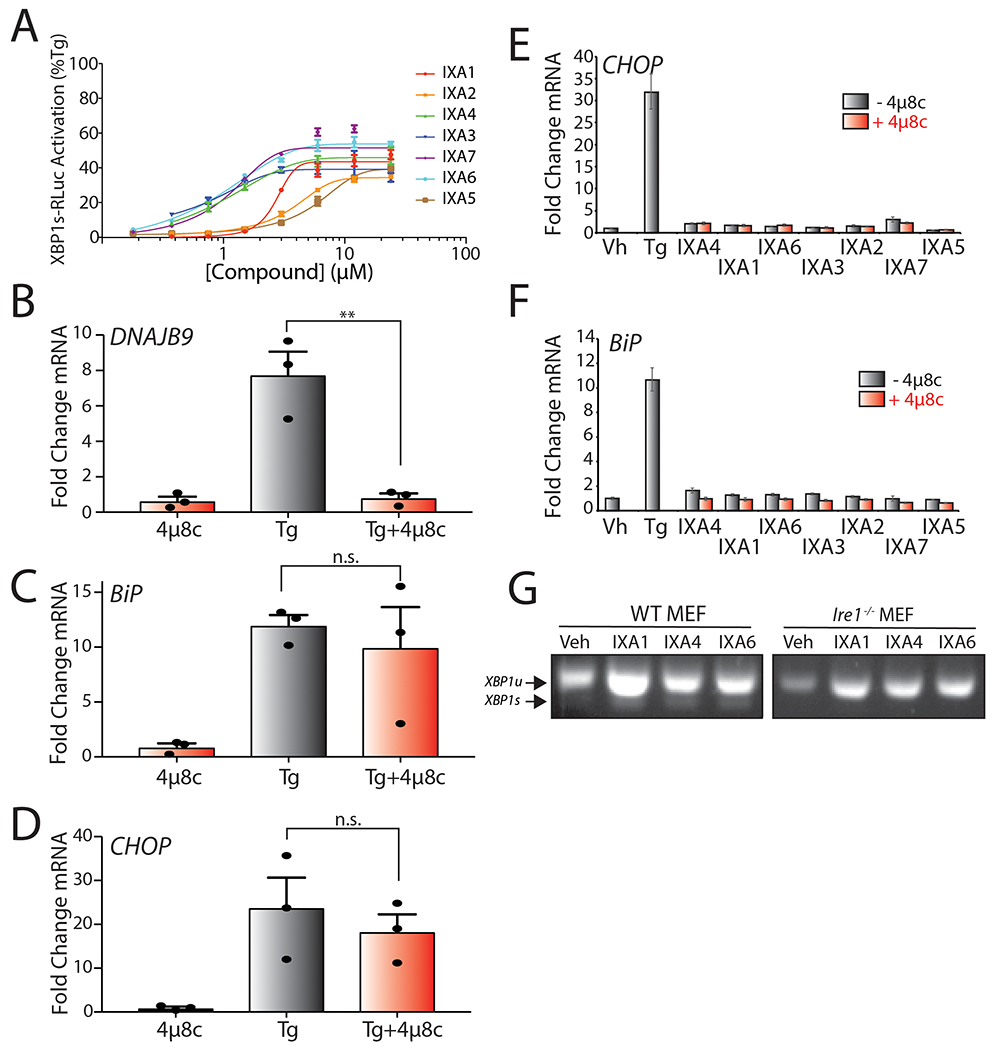
Extended Data Fig. 2.

A. Plot showing XBP1-RLuc activation in HEK293TREX cells (% signal compared to that observed with 500nM Tg, 18 hrs) treated for 18 hrs with the indicated concentrations of prioritized IRE1/XBP1s activator. Error bars represent SD for n = 3 replicates.
B. Graph showing qPCR of the XBP1 target gene DNAJB9 in HEK293T cells treated for 4 hrs with Tg (500 nM) in the presence or absence of 4μ8c (64 μM). Error bars show SE for n= 3. P-values were calculated using one-tailed Student’s t-test. **p<0.01.
C. Graph showing qPCR of the ATF6 target gene BiP in HEK293T cells treated for 4 hrs with Tg (500 nM) in the presence or absence of 4μ8c (64 μM). Error bars show SE for n= 3. P-values were calculated using one-tailed Student’s t-test.
D. Graph showing qPCR of the PERK target gene CHOP in HEK293T cells treated for 4 hrs with Tg (500 nM) in the presence or absence of 4μ8c (64 μM). Error bars show SE for n= 3. P-values were calculated using one-tailed Student’s t-test.
E. Graph showing qPCR of the PERK target gene CHOP in HEK293T cells treated for 4 hrs with prioritized IRE1/XBP1s activators (10 μM) or Tg (500nM), in the presence or absence of 4μ8c (32 μM). Error bars show 95% CI for n= 3 replicates.
F. Graph showing qPCR analysis of the ATF6 target gene BiP in HEK293T cells treated for 4 hrs with indicated compound (10 μM), or Tg (500nM), in the presence or absence of 4μ8c (32 μM). Error bars show 95% CI for n= 3 replicates.
G. cDNA gel showing splicing of XBP1 mRNA in WT MEF or Ire1−/− MEF cells treated with IXA1, IXA4, or IXA6 (10 μM) for 4 hrs.
