
Extended Data Fig. 3.
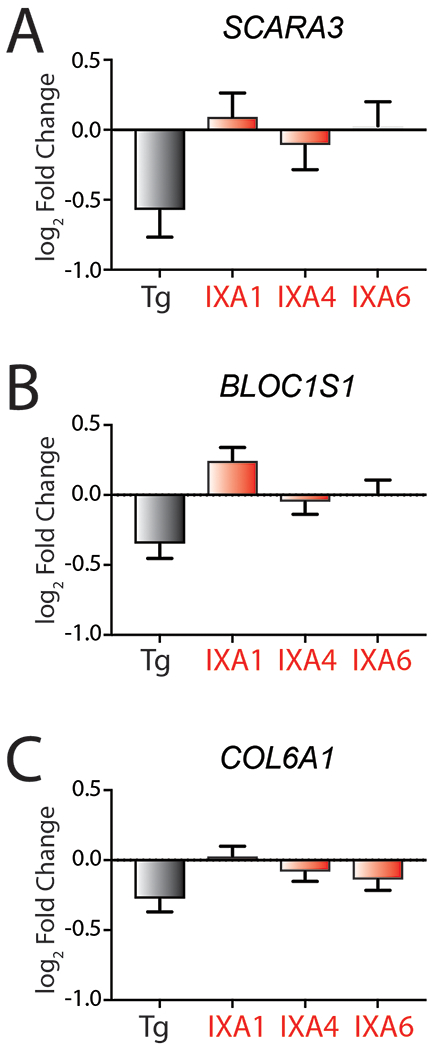
A. Graph showing log2 Fold change mRNA levels from RNAseq for the RIDD target SCARA3 in HEK293T cells treated with 10 μM IXA1, IXA4, IXA6, or 500 nM Tg for 4 hrs. Error bars represent SD for n = 3 replicates.
B. Graph showing log2 Fold change mRNA levels from RNAseq for the RIDD target BLOC1S1 in HEK293T cells treated with 10 μM IXA1, IXA4, IXA6, or 500 nM Tg for 4 hrs. Error bars represent SD for n = 3 replicates.
C. Graph showing log2 Fold change mRNA levels from RNAseq for the RIDD target COL6A1 in HEK293T cells treated with 10μM IXA1, IXA4, IXA6, or 500nM Tg for 4 hrs. Error bars represent SD for n = 3 replicates.