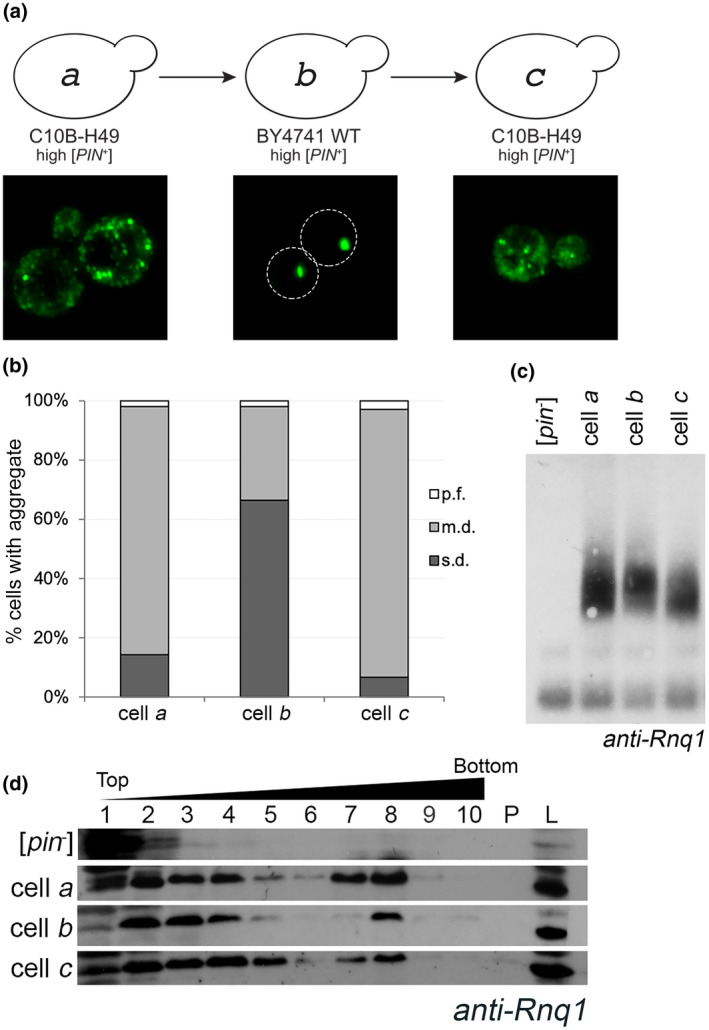
FIGURE 1.

The aggregation phenotype of high [PIN +] in the C10B‐H49 background is maintained after it is transferred through the BY4741 genetic background. (a) Diagram of cytoduction, with representative fluorescent micrographs below. All cytoductions involved transfer of prions from a [PIN +] donor to a [pin −] recipient. Diagram and fluorescent images depict the prion variant after cytoduction. A high [PIN +] C10B‐H49 donor (represented by cell a) was used to introduce the prion into a [pin −] BY4741 background. The resulting cytoductant is represented by cell b. Cell b (high [PIN +] BY4741) was used to introduce the prion into a [pin −] version of C10B‐H49. The cytoductant is represented by cell c. Transient overexpression of Rnq1‐GFP allows for the detection of aggregates within the cytoductants. Representative images are deconvolved maximum image projections of several z‐stacks. (b) Cells containing multiple dots (m.d.), single dot (s.d.), or petite foci (p.f.) were assessed in four independent cultures from each strain. A minimum of 300 cells per culture was scored and means of each population are shown. The number of m.d.‐containing cells in BY4741 recipient strains were significantly different compared to C10B‐H49 donor and recipient cells, as determined by Chi‐square test of independence (p < .0001). (c) Fresh lysates from the indicated strains, including C10B‐H49 [pin −] in the first lane, were run on an SDD‐AGE and analyzed by Western blot using anti‐Rnq1 antibody. Due to several cross‐reacting bands between 20 and 120 kDa using this polyclonal antibody, SDD‐AGE is able to confirm presence or absence of higher molecular weight oligomers, but does not have adequate resolution to affirm presence of the Rnq1 monomer. More definitive evidence for the presence of Rnq1 monomer in [pin −] strains is provided via SDS‐PAGE (Figure S5). (d) Lysates from the indicated strains, including 74D‐694 [pin −] as the top row, were loaded onto discontinuous sucrose (10%, 40%, and 60% sucrose) gradients and fractionated. 10 fractions were collected. Fractions 7 and 8 usually are the interphase between the 40% and 60% sucrose. Protein pelleted at the bottom of the gradient (P) and whole‐cell lysates (L) are shown [Colour figure can be viewed at wileyonlinelibrary.com]
