FIGURE 2.

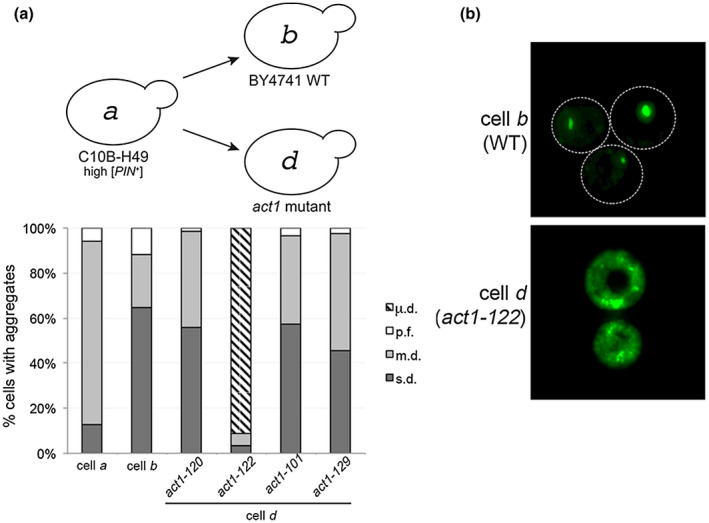
New aggregation phenotype, µ.d., found in act‐122 cytoductant. (a) High [PIN +] was cytoduced from wildtype C10B‐H49 (cell a) into [pin −] BY4741 wildtype or actin mutant recipient strains. The diagram depicts the prion variant after cytoduction. The type of aggregates found in each strain was counted as described in Figure 1b. Each bar represents the mean of four independent cultures and a minimum of 300 cells per culture. (b) Fluorescent micrographs of [PIN +] in wildtype BY4741 and act1‐122 BY4741 strains. While representative images are deconvolved maximum image projections of several z‐stacks, additional contrast was added to cell d to demonstrate the visual differences between both strains (see Figure S8 for raw time‐lapse images) [Colour figure can be viewed at wileyonlinelibrary.com]
