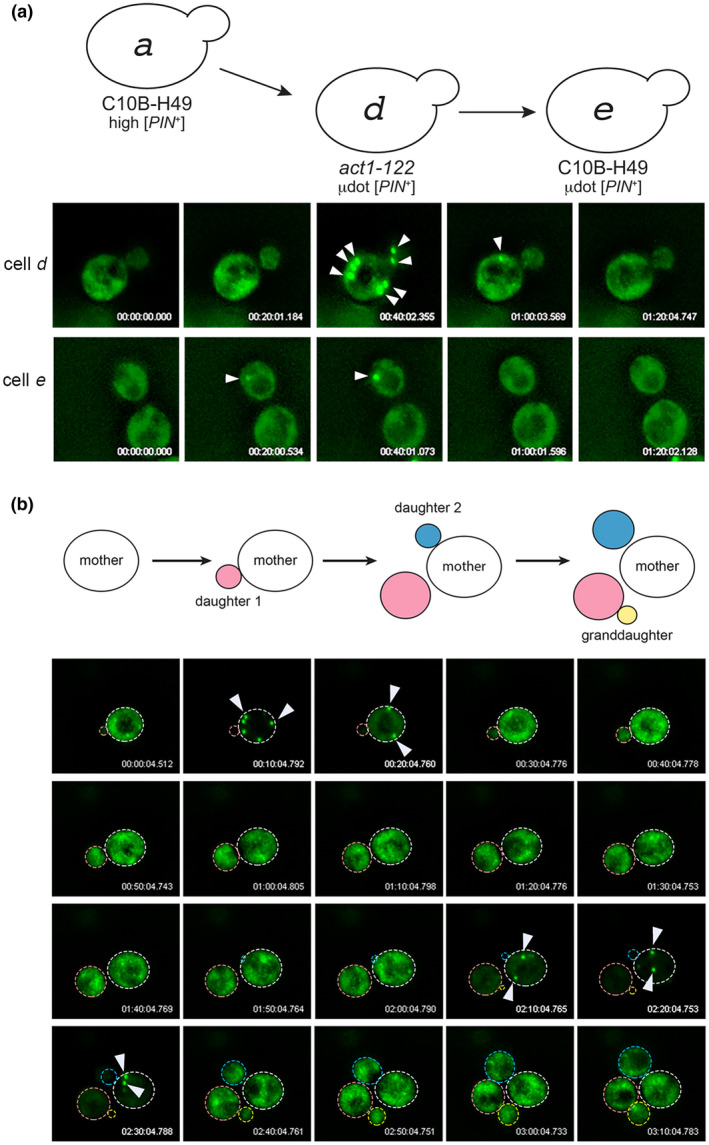
FIGURE 4.

Cells containing µdot [PIN+] show transient large aggregates. (a) 3D time‐lapse imaging of cell d (act1‐122) or cell e (wildtype C10B‐H49) containing µdot [PIN+]. The appearance and disappearance of large aggregates are indicated with arrowheads. (b) A 3D time‐lapse of a single dividing cell shows the appearance and disappearance of large aggregates over several cell divisions. All 3D time‐lapse imaging was done without addition of copper sulfate, such that low Rnq1‐GFP fluorescence reflects trace amounts of copper sulfate in the synthetic complete media (see Experimental Procedures) [Colour figure can be viewed at wileyonlinelibrary.com]
