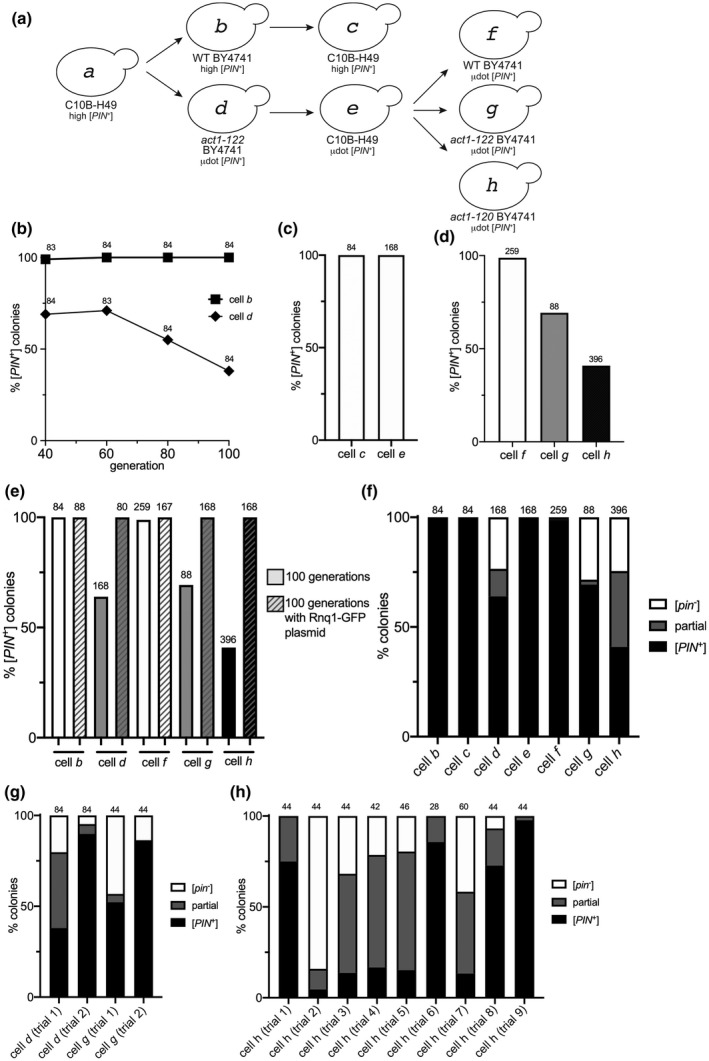
FIGURE 5.

µdot [PIN+] is mitotically unstable in BY4741 strains containing the act1‐122 and act1‐120 mutations. (a) µdot [PIN+] from cell e was cytoduced into wildtype BY4741 (cell f), act1‐122 BY4741 (cell g), or act1‐120 BY4741 (cell h). Cytoductions involving cells a through e are described on the previous figures. (b) Strains represented by cells b and d were propagated for the indicated generations. Individual colonies were mated to a Rnq1‐GFP tester strain and each diploid colony was scored for the complete loss of [PIN +] by the detection of diffuse fluorescence in all of the cells within the population. The number of colonies scored (n) is indicated above each data point. In generations 60–100, the act1‐122 BY4741 strain (cell d) lost the [PIN +] prion in a linear manner (R 2 = 1), whereas loss was not observed in wild type (slope = 0; R 2 = 1). The slope of [PIN +] loss in act1‐122 BY4741 is significantly different from wild type (p < 0.005). (c) The percent of colonies that lost the prion in C10B‐H49 strains containing either high [PIN +] (cell c) or µdot [PIN+] (cell e) after 100 generations of growth. (d) Percent of colonies that lost µdot [PIN+] in wildtype (cell f), act1‐122 (cell g), or act1‐120 (cell h) strains. (e) Comparison of prion loss for all BY4741 strains. All strains were propagated for 100 generations, both with and without the RNQ1‐GFP plasmid (p3034), and individual colonies were scored for [PIN+] loss. (f) A summary of prion loss of all strains (cells b through h). Colonies composed only of cells containing diffuse fluorescence ([pin −], white box), colonies composed of a mix of cells with either diffuse or fluorescent aggregates (partial, gray box), and colonies where all cells have aggregates ([PIN +]; black box) are shown. (g and h) Prion loss observed in individual trials (replicates using independent lab strains, Table S1) of act1‐122 BY4741 (cell d or g) and act1‐120 BY4741 (cell h) strains containing µdot [PIN+]. For all charts, values provided above individual bars or graph data points indicate the total number of colonies assayed.
