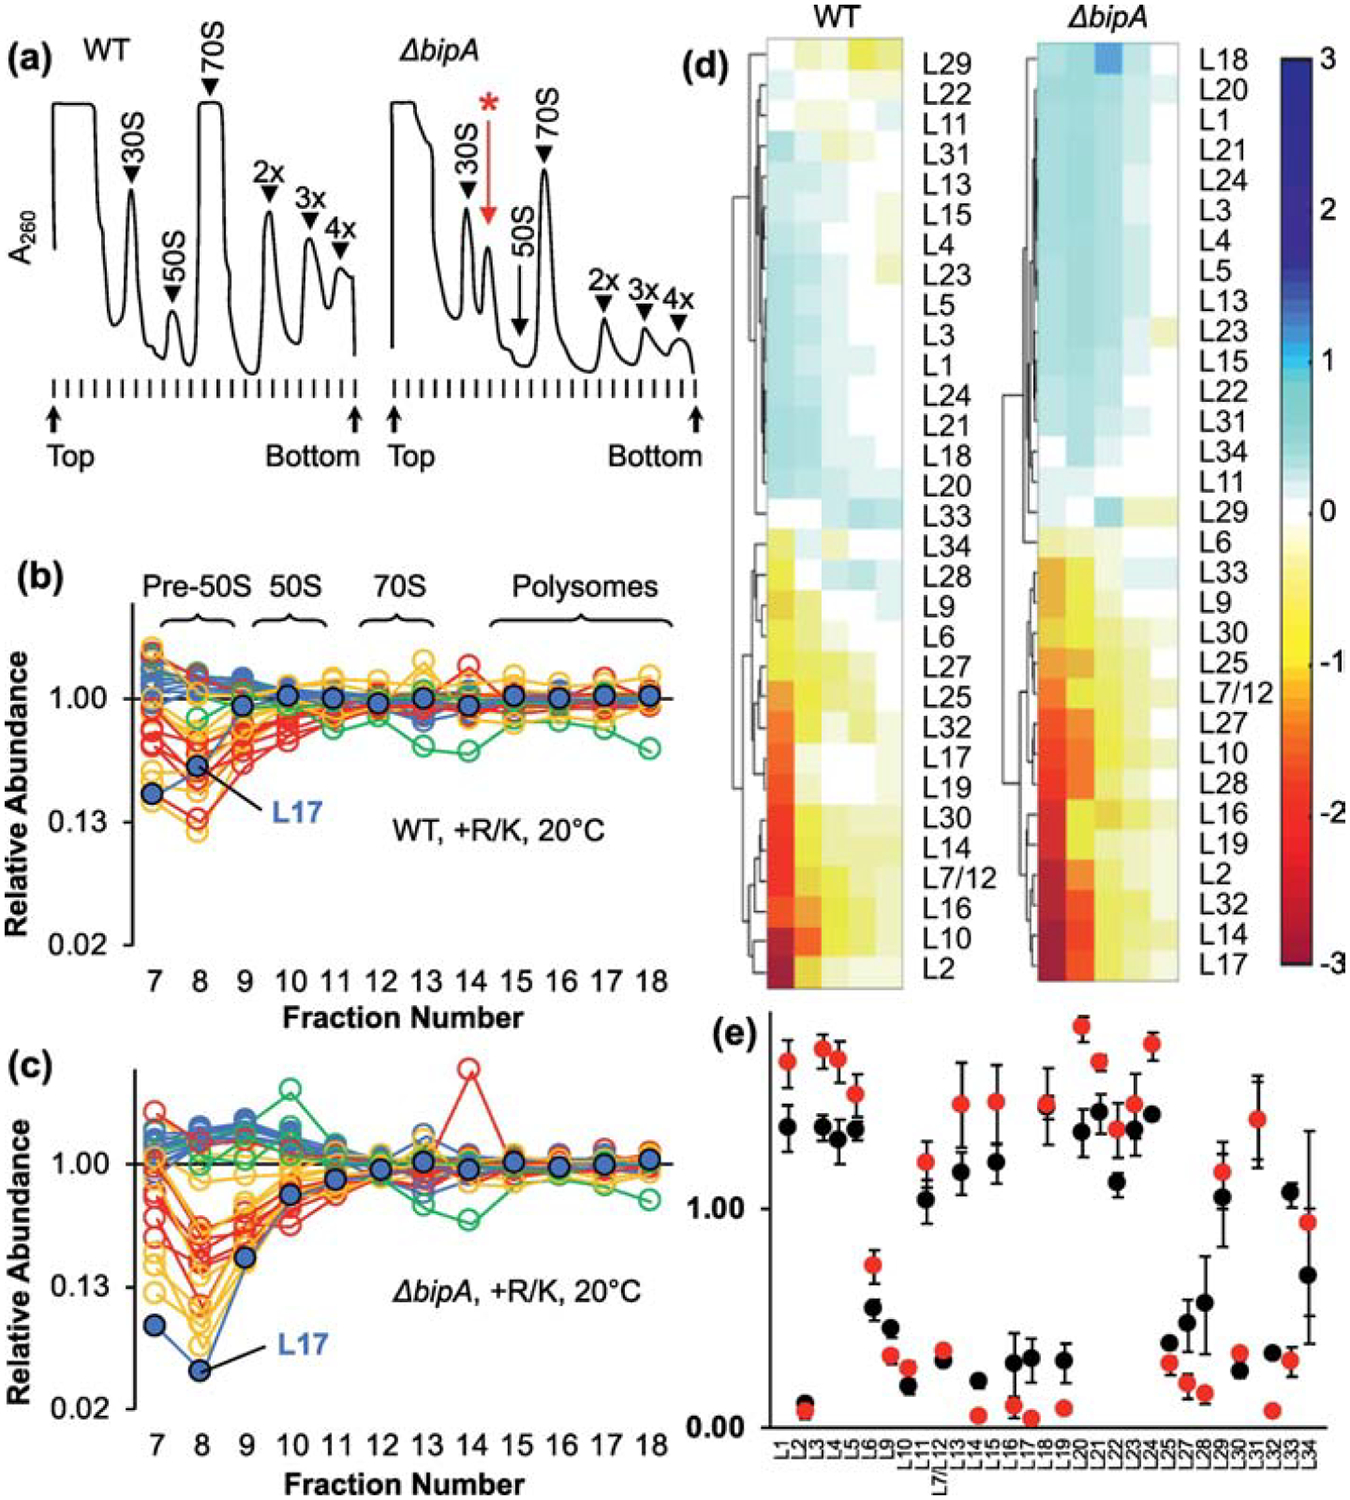
Figure 2. Composition of ribosomal particles in control and ΔbipA cells.

(a) Representative A260 traces of sucrose gradients from WT (left) and ΔbipA (right) cells grown at 20 °C. Peaks corresponding to subunits (30S, 50S), monosomes (70S), and polysomes (2x, 3x, 4x) are indicated. A prominent pre-50S peak seen in the ΔbipA case is indicated with a red asterisk. (b, c) Plotted are the normalized isotope ratios indicating the relative abundance of each LSU protein in each fraction (7–18) for WT (b) and ΔbipA cells (c) across the gradient. Color coding corresponds to temporal stages of assembly as defined by Chen and Williamson 2013 (blue, early; green, middle; yellow, middle-late; red, late). L17 is highlighted with a black outline. Data represent the mean of 3 independent experiments. Full datasets are included in Table S1. (d) Hierarchical clustering analysis of LSU abundance data using fractions 8–12. Color bar on right indicates degree of representation from blue (overrepresented) to red (underrepresented). (e) Protein composition of pre-50S fraction 8 from WT (black circles) and ΔbipA (red circles) cells. Data represents mean ± SEM from three independent replicates.
