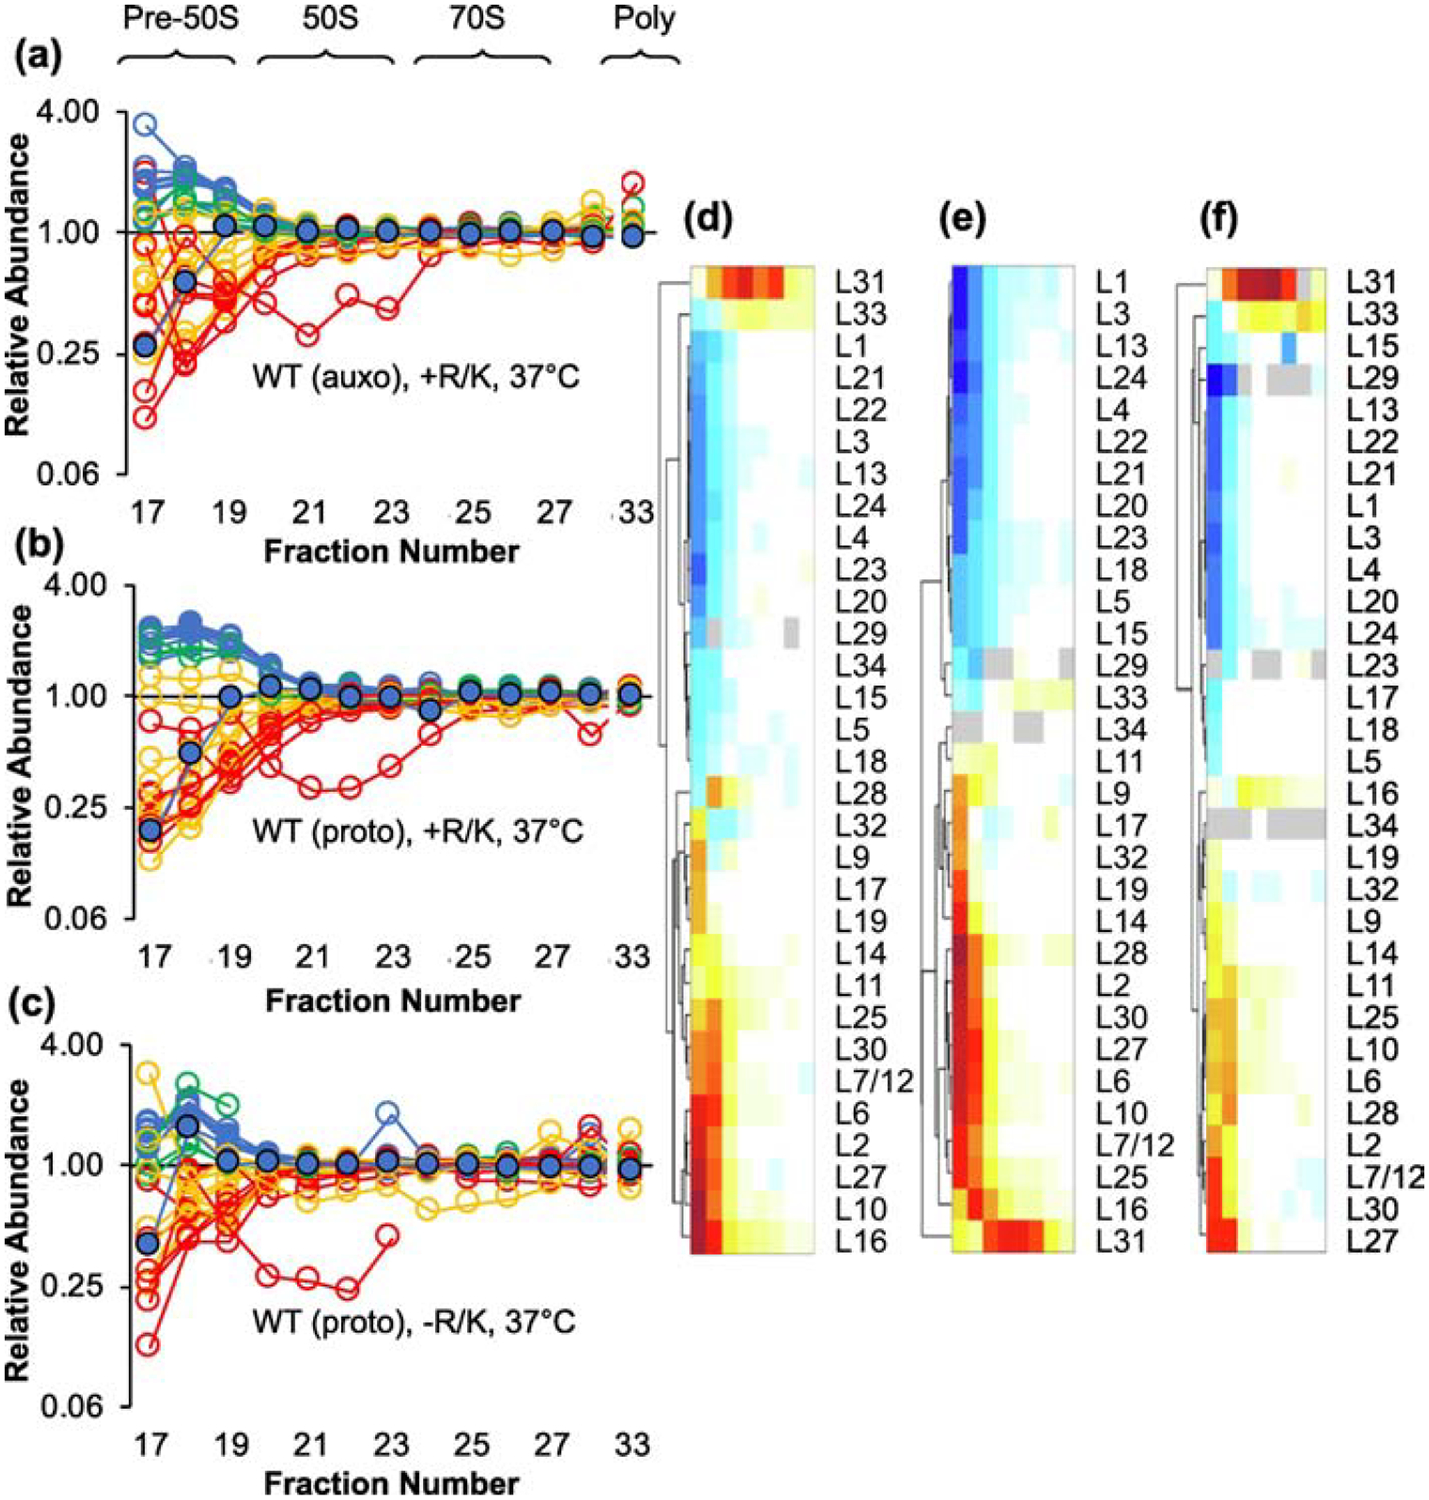
Figure 3. Amino acid supplementation influences the kinetics of LSU assembly.

Shown are the relative abundance of LSU proteins in pre-50S and 50S particles from the control (WT) auxotroph grown with Arg and Lys supplementation (a), the control (WT) prototroph grown with Arg and Lys supplementation (b), and the control (WT) prototroph grown without supplementation (c). Color coding is based on temporal stages defined by Chen and Williamson, 2013 (blue, early; green, middle; yellow, middle-late; red, late). L17 is highlighted with a black outline. Data represent the mean of 3 independent experiments. Full datasets are included in Table S1. Hierarchical clustering of the data in (a), (b), and (c) is shown in (d), (e), and (f), respectively. Color scale as in Figure 2(d).
