
Figure 5. Loss of BipA leads to lower levels of 17S precursor rRNA.
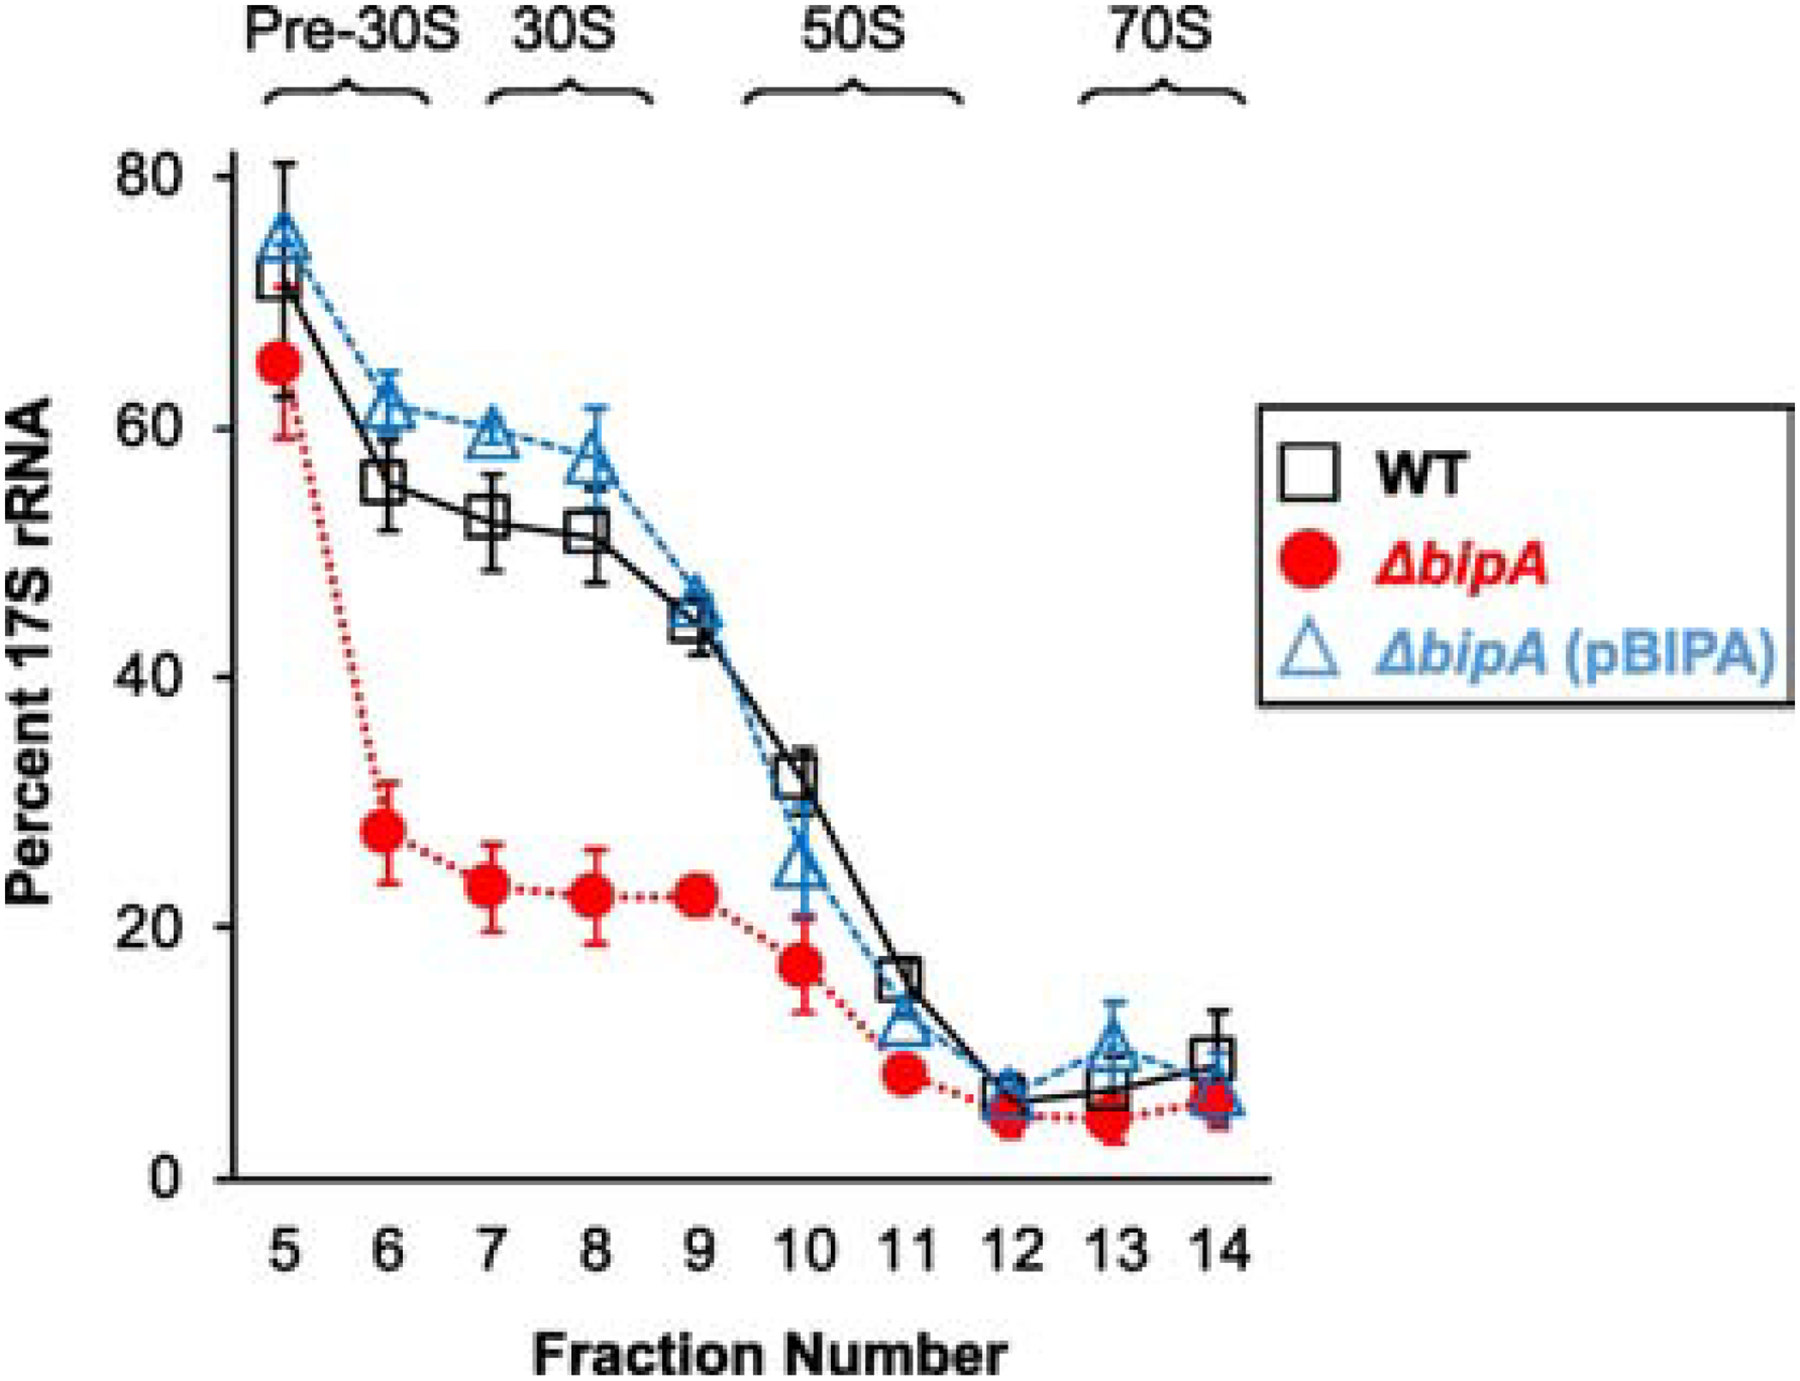
Total RNA was extracted from sucrose gradients fractions 5–14 (as indicated), SSU rRNA was resolved by PAGE, and 17S rRNA and 16S rRNA bands were quantified. The amount of 17S rRNA (percent of SSU rRNA) is plotted as a function of fraction number. Data represent mean ± SEM for three independent replicates. Black squares, WT; red circles, ΔbipA; blue triangles, ΔbipA (pBIPA).