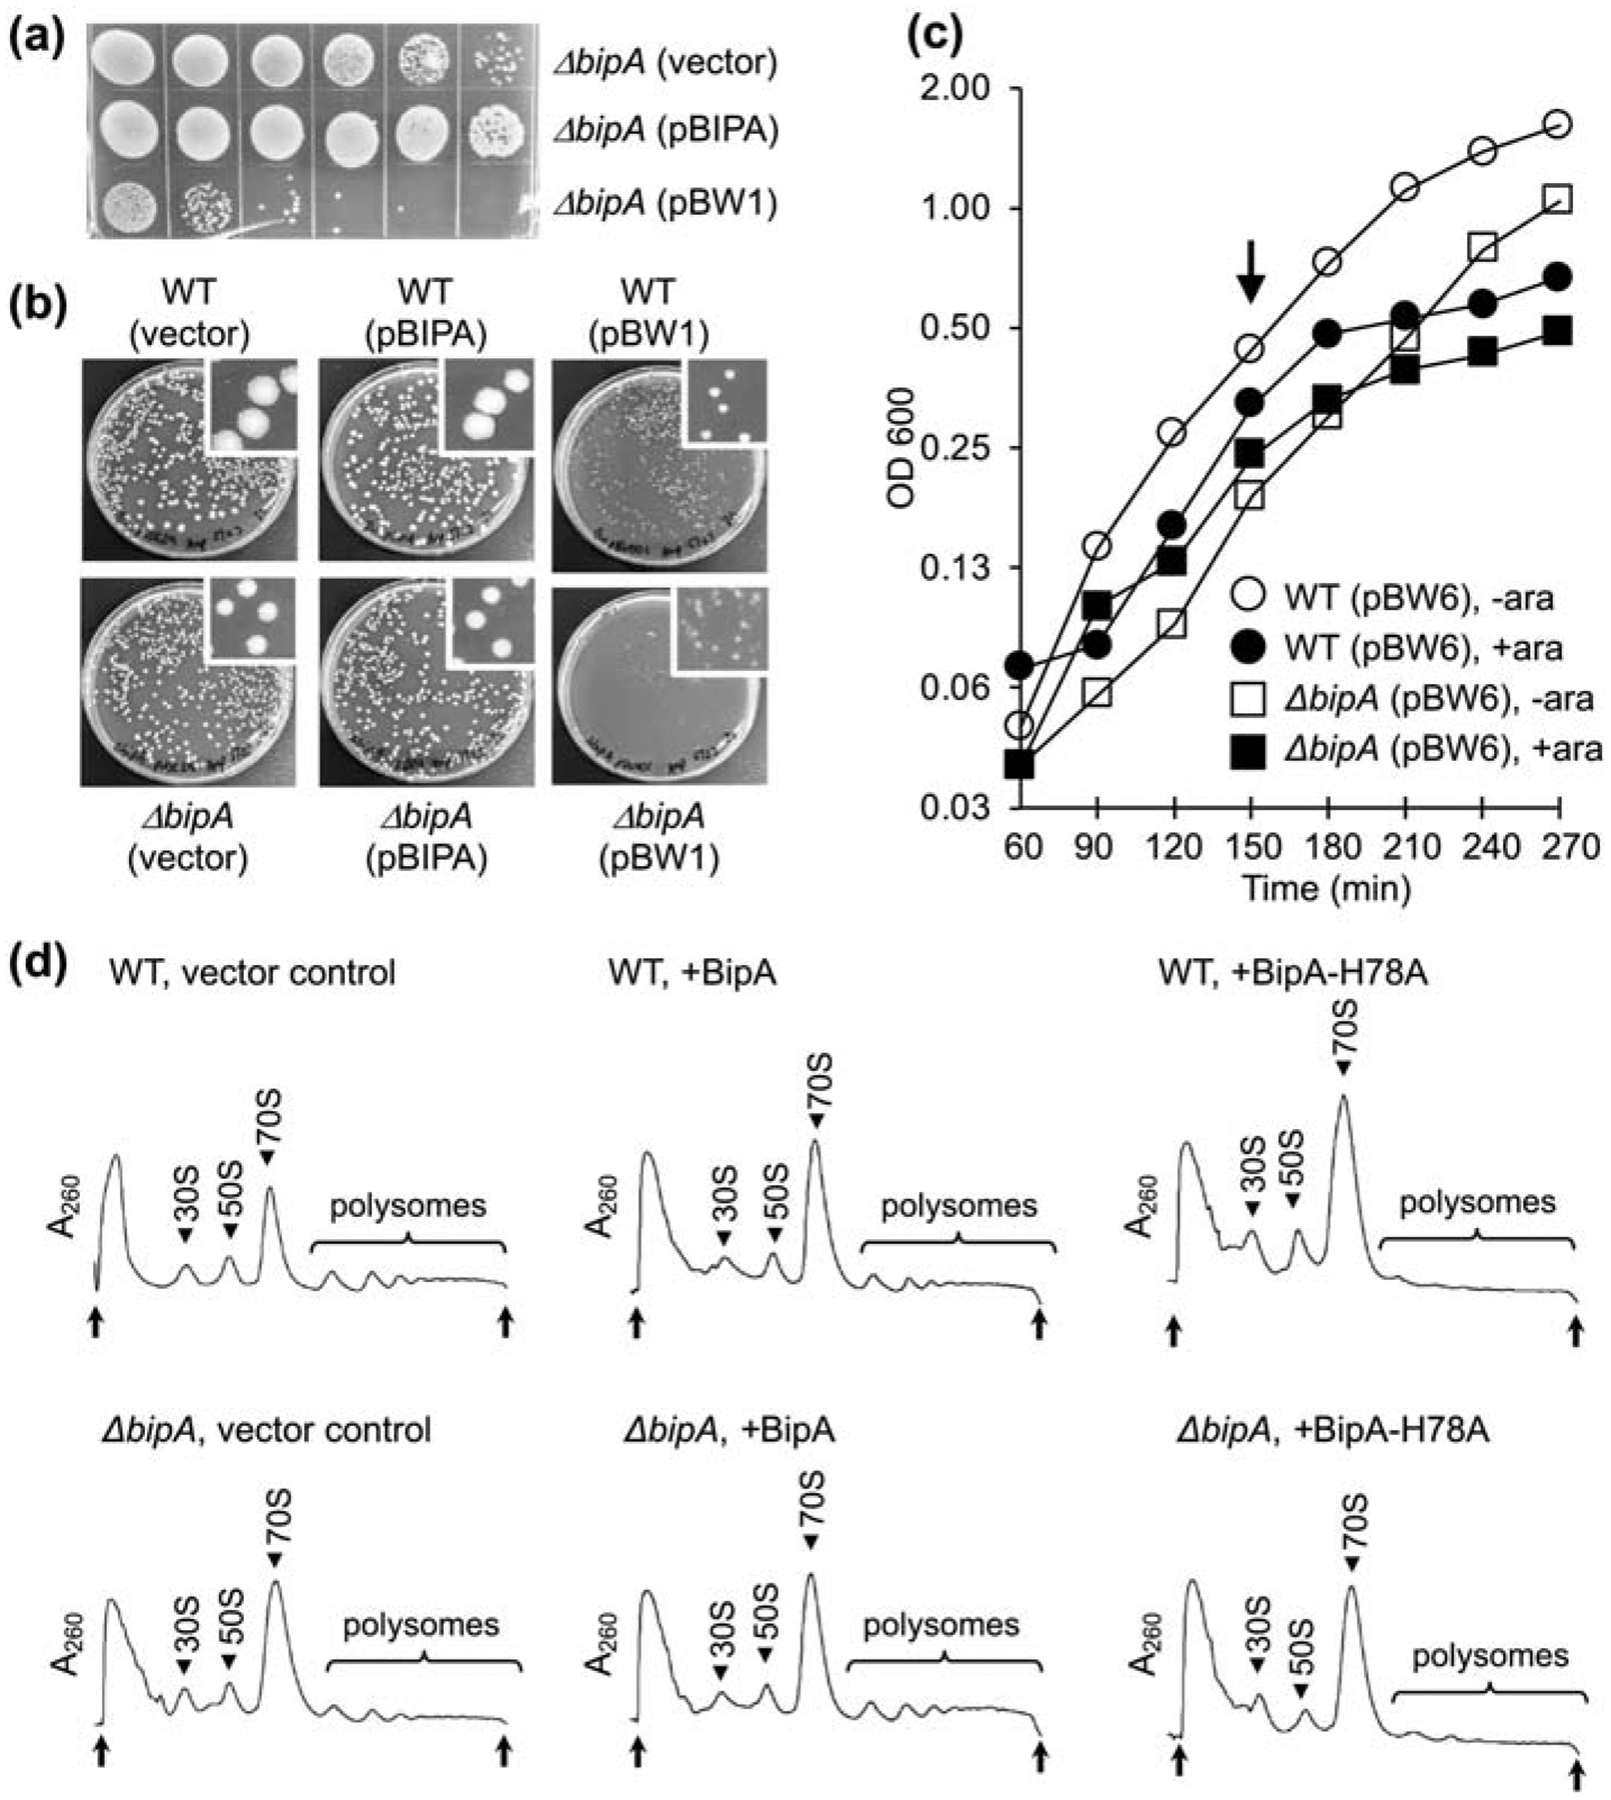
Figure 6. Production of BipA-H78A confers a dominant negative phenotype.

(a) A spot assay comparing growth at 20 °C of ΔbipA cells harboring the empty vector, pBIPA (encoding BipA), or pBW1 (encoding BipA-H78A), as indicated. Cultures of equivalent OD600 were serially diluted, and corresponding diluted cells (20 μL) were spotted onto plates and incubated for 3 days. (b) Transformation plates showing the deleterious effects of BipA-H78A. Cells (WT or ΔbipA) were transformed with the empty vector, pBIPA (encoding BipA), or pBW1 (encoding BipA-H78A), as indicated, and plated on selective media and grown at 37 °C. (c) Growth at 37 °C of WT and ΔbipA cells containing pBW6, encoding BipA-H78A, with or without arabinose induction (as indicated). Arrow indicates time of induction. (d) Inhibition of translation by BipA-H78A. Cells (WT or ΔbipA, as indicated) containing pBAD24 (empty vector), pBW2 (encoding BipA), or pBW6 (encoding BipA-H78A) (as indicated) were grown at 37 °C to mid-log phase, induced with arabinose (0.2% W/V) to express protein for 70 min, and subjected to sucrose gradient sedimentation analysis. Peaks corresponding to subunits (30S, 50S), monosomes (70S), and polysomes are indicated. Top and bottom of each gradient are marked with arrows.
