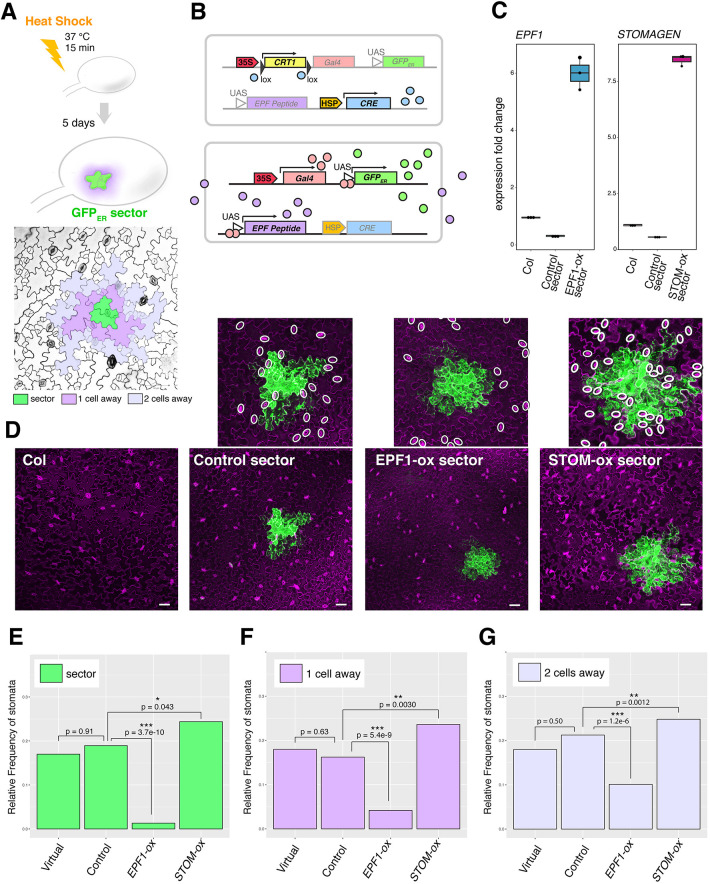
Fig. 1.
Mosaic sectors overexpressing EPF peptides non-cell autonomously influence stomatal patterning. (A) Top: Experimental design for generating ER-trapped GFP (GFPER) sectors by heat-shock treatment. Bottom: False-colored confocal microscopy image of an abaxial epidermis; green, a sector; purple, cells immediately adjacent to the sector (one cell away); lilac, cells two cells away from the sector. (B) Scheme of heat-shock induced Cre-lox recombination and induction of GFPER as well as secreted EPF peptides. Top: Heat-shock promoter drives expression of CRE recombinase (light blue), which acts on lox recombination sites (black triangles) to cleave off the E.uredovora CRT1 gene (yellow). Bottom: Removal of insulator gene CRT1 now drives Gal4 (peach) under the control of CaMV35S promoter. The Gal4 protein binds to the UAS at the promoter of GFPER (green) as well as EPF peptide gene (purple). The resulting GFPER protein marks the mosaic sectors, whereas EPF peptides are secreted to the apoplast. (C) Quantitative RT-PCR analysis of transcripts of EPF1 (left) and STOMAGEN (right) from 7-day-old seedlings of non-transformed Col, control sector expressing GFPER only and sectors expressing EPF1 (EPF1-ox) or STOMAGEN (STOM-ox). The transcripts are normalized against Actin expression (ACT2). Three biological replicates were performed, each with three technical replicates, and representative results are shown. (D) Z-stacked, tile-scanned representative confocal microscopy images of 7-day-old cotyledons subjected to heat-shock treatment as described in A. From left, non-transformed Col-0, transgenic lines expressing a control sector, EPF1-ox sector, and STOM-ox sector. Insets above show close-up images of each sector with stomata highlighted by white ovals. For tile scan of the entire cotyledons, see Fig. S1. (E-G) Relative frequency of stomata (number of stomata per total number of epidermal cells) within sectors (E; green), cells immediately adjacent to sectors (F; purple, ‘one cell away’), and cells adjacent to immediate neighboring cells (G; lilac, ‘two cells away’). For wild type cotyledons, virtual geometric sectors of the same size and geometry as real sectors were computationally placed. Total numbers of stomata and epidermal cells were aggregated to generate a single dataset for each genotype to enable robust statistical testing. Numbers of sectors subjected to analysis: n=20 (geometric), n=34 (control), n=25 (EPF1-ox), n=31 (STOM-ox). Total numbers of stomata and non-stomatal epidermal cells counted in sectors: n=229 (geometric), n=364 (control), n=228 (EPF1-ox), n=410 (STOM-ox). Total numbers of stomata and non-stomatal epidermal cells counted adjacent to sectors: n=384 (geometric), n=564 (control), n=358 (EPF1-ox), n=817 (STOM-ox). Total numbers of stomata and non-stomatal epidermal cells counted adjacent to immediate neighboring cells: n=702 (geometric), n=952 (control), n=633 (EPF1-ox), n=1398 (STOM-ox). A χ-square analysis was performed to test significant deviation between the frequencies of two aggregated samples;*P<0.05, **P<0.005, ***P<0.0005. Scale bars: 50 µm.

