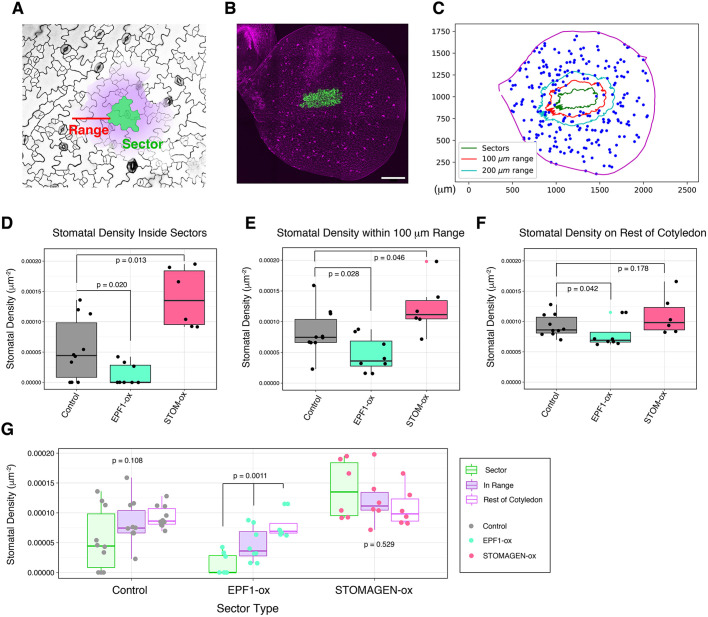
Fig. 3.
Quantitative analysis of effective range by non-cell autonomous effects of EPF1- and Stomagen-overexpressing sectors. (A) The coordinate outline of a given sector (green) was enlarged to generate a new coordinate boundary at a defined range (red; in this case, 100 µm) away from the sector outline. The defined range maintains the geometry of the original sector. The stomatal density was calculated in three regions: the interior of the original sector outline (green), the interior of the expanded range, excluding the original sector (purple, but not green); and the rest of the cotyledon (white). (B) Z-stacked, representative tile scan of a whole cotyledon with sectors overexpressing EPF1 (EPF1-ox). For tile scans of other genotypes, see Fig. S1. (C) Representative 2D coordinate mapping of the cotyledon boundary (magenta), the sector boundaries (green), the boundaries of expanded ranges at 100 µm (red) and 200 µm, and stomata (blue). Note that if the expanded range extends beyond the actual cotyledon boundaries, this extended area is excluded from analysis. (D) Stomatal density inside of sectors for individual cotyledons: cotyledons with control sector(s) expressing GFPER only (gray; n=10); cotyledons with EPF1-ox sector(s) (teal; n=8); cotyledons with sectors overexpressing Stomagen (STOM-ox) (coral red; n=6). Total numbers of stomata counted in sectors: n=24 (control), n=5 (EPF1-ox), n=50 (STOM-ox). A Mann–Whitney U-test was performed to test significant deviation between distributions of stomatal density. (E) Stomatal density within 100 µm range of sectors for individual cotyledons; cotyledons analyzed are same as in D. Total numbers of stomata counted within 100 µm range: n=116 (control), n=52 (EPF1-ox), n=148 (STOM-ox). A Mann–Whitney U-test was performed to test significant deviation between distributions of stomatal density. Red dot indicates an outlier (>Q3+1.5×IQR) for STOM-ox sector. (F) Stomatal density outside of the specified regions in D and E for individual cotyledons; cotyledons analyzed are the same as in D. Total numbers of stomata counted on the remaining area of cotyledons: n=2229 (control), n=1765 (EPF1-ox), n=1306 (STOM-ox). A Mann–Whitney U-test was performed to test significant deviation between distributions of stomatal density. Lime green dot indicates an outlier (>Q3+1.5×IQR) for EPF1-ox sector. (G) Data provided in D-F, grouped by sector type and region of stomatal density. For each sector type, a Kruskal–Wallis (non-parametric ANOVA) test was performed to test significant deviation in stomatal density in sectors versus 100 µm range versus rest of cotyledon. Scale bar: 250 µm.

