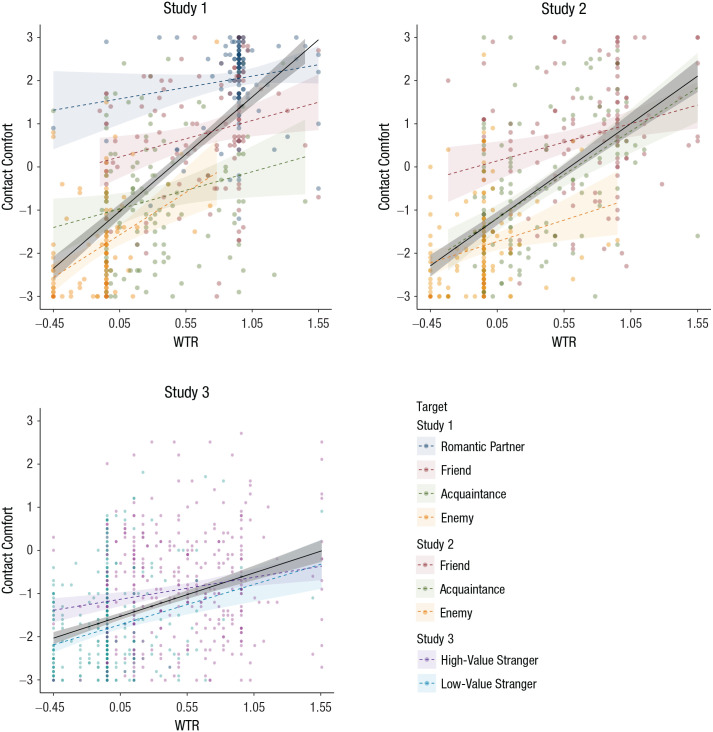
Fig. 2.
Relations between welfare-trade-off ratio (WTR) and comfort with infection-risky contact, separately for each target type in Studies 1 through 3. In each scatterplot, the solid line indicates the best-fitting relationship between WTR and contact comfort across categories, and the dashed lines indicate the best-fitting relationship within each target category. Shaded areas around the regression lines indicate 95% confidence intervals.

