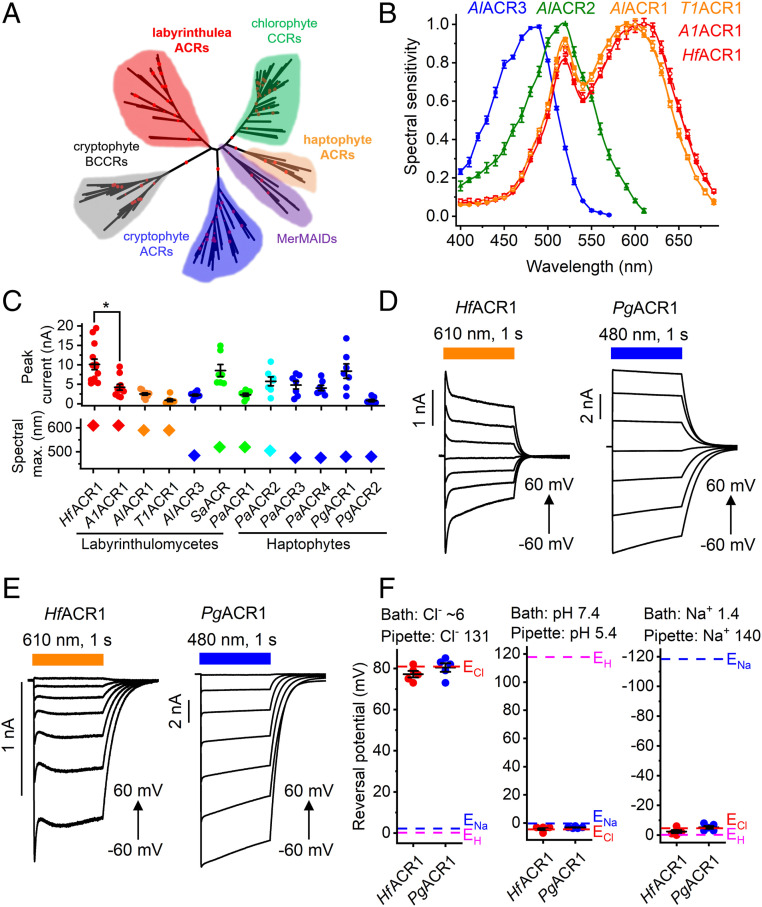
Fig. 1.
(A) A phylogenetic tree of rhodopsin domains constructed by the neighbor-joining method. The ultrafast bootstrap support values are shown by red circles (95 to 100% range). The GenBank accession numbers and source organism names of the sequences used are listed in SI Appendix, Tables S2 and S3, and in Dataset S1. (B) The action spectra of photocurrents generated by indicated ACRs. The data points are the mean values ± SEM (n = 6 to 10 scans). The spectral sensitivity was defined as the slope of current rise; see Materials and Methods for more detail. (C) The peak current amplitudes (Top) and spectral maxima (Bottom) of all functional ACRs tested in this study, except AlACR2, were generated in response to the first 1-s light pulse after seal formation. The data from individual cells are shown as circles; the lines show the mean values ± SEM (n = 7 to 13 cells). The diamonds show spectra maxima determined from the averaged spectra. (D and E) Series of photocurrents recorded using the indicated Cl− concentrations (in mM) at voltages changed from −60 to 60 mV at the amplifier output. (F) The reversal potentials (Erev) of photocurrents measured under indicated ionic conditions (in mM). The data from individual cells are shown as circles; the lines show the mean values ± SEM (n = 5 cells). The Erev values were corrected for liquid junction potentials, as described in Materials and Methods.

