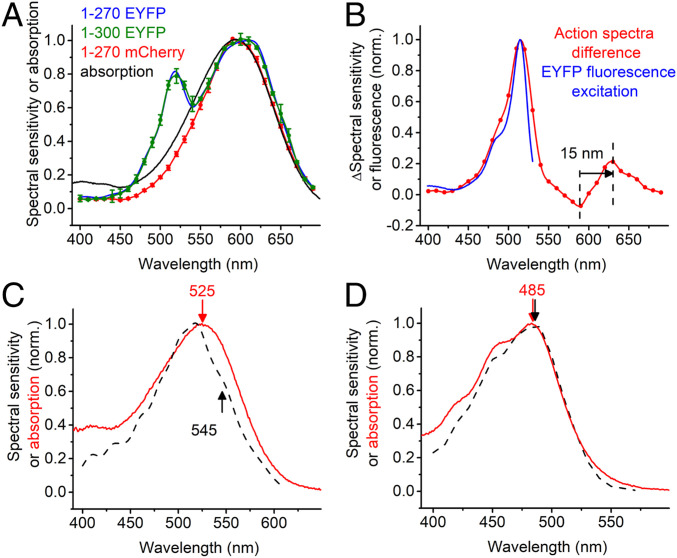
Fig. 3.
(A) The action spectra of photocurrents generated by A1ACR1 fused to EYFP (amino acids 1 to 270 or 1 to 300) or mCherry and the absorption spectrum of fluorescence tag-free A1ACR1 purified from Pichia. (B) The difference between the action spectra obtained with A1ACR1_EYFP and AlACR1_mCherry and the fluorescence excitation spectrum of EYFP from FPbase (https://www.fpbase.org/protein/eyfp/). (C and D) The action spectra of photocurrents recorded by AlACR2 (C) and AlACR3 (D) EYFP fusions (black dashed lines, reproduced from Fig. 1B) and the absorption spectra of the respective purified proteins (red lines).

