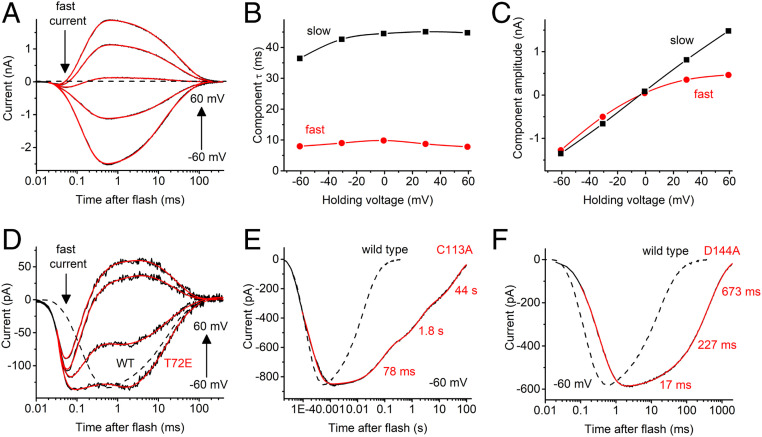
Fig. 4.
(A) A series of photocurrent traces recorded from AlACR1 upon laser flash excitation at the voltages changed in 20-mV increments from −60 to 60 mV at the amplifier output. Black lines, experimental data; red lines, multiexponential fit. (B and C) The dependence of the decay components τ (B) and amplitude (C) on the holding voltage for the series of traces shown in A. (D) A series of photocurrent traces recorded from the AlACR1_T72E mutant at incremental voltages from −60 to 60 mV. The wild-type trace at −60 mV from A is shown as a dashed line for comparison. (E and F) The current traces recorded from the indicated AlACR1 mutants at −60 mV (solid lines) as compared to the wild-type trace (dashed lines).

