Fig. 1.
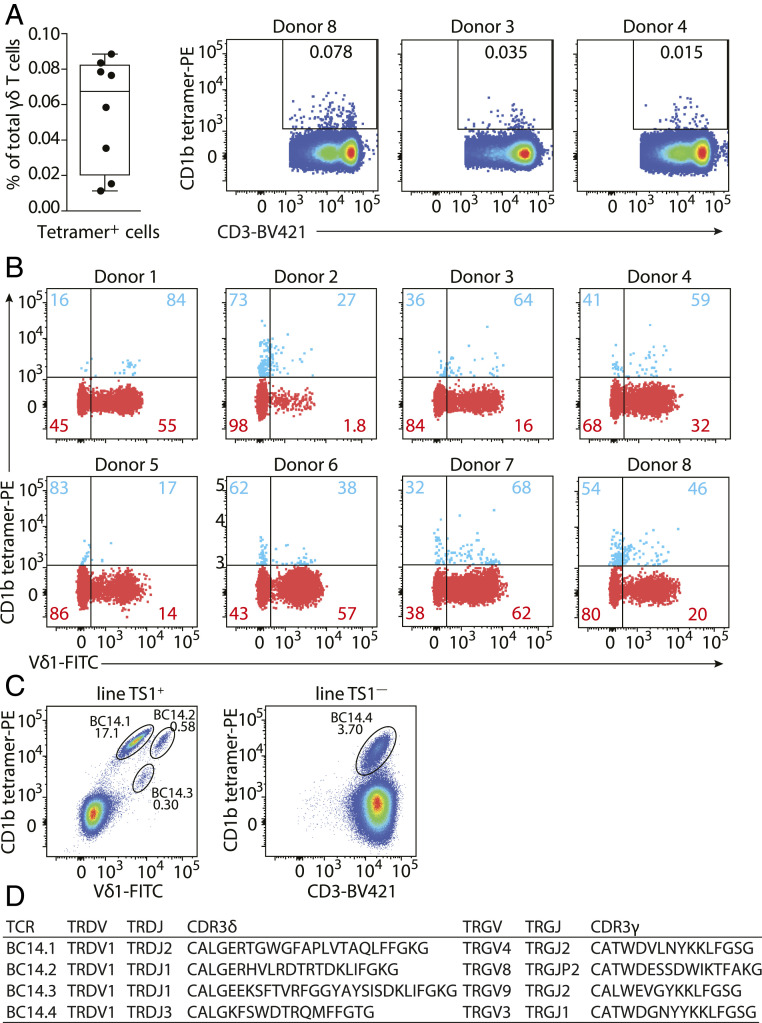
Identification of CD1b-endo-recognizing γδ T cells. (A) Percentages of CD1b-endo tetramer+ γδ T cells of total γδ T cells enriched from PBMCs by column purification (n = 8 PBMC samples) are shown. Flow cytometry dot plots show CD1b-endo tetramer staining of γδ T cells from three representative donors (gated as shown in SI Appendix, Fig. S1). (B) Overlaid flow cytometry dot plots of CD1b-endo tetramer+ (blue) and CD1b-endo tetramer− (red) γδ T cell populations from eight donors (gated as shown in SI Appendix, Fig. S1). Percentages of Vδ1− and Vδ1+ cells are shown separately for the CD1b tetramer+ and CD1b tetramer− populations. (C) Flow cytometric dot plots of line TS1+ (gated on CD3+ cells) and line TS1−. Four CD1b tetramer-positive populations can be observed: BC14.1, BC14.2, BC14.3, and BC14.4. (D) Paired TCR sequences of four human CD1b-endo-recognizing γδ TCRs determined using a multiplex PCR and Sanger sequencing-based approach.

