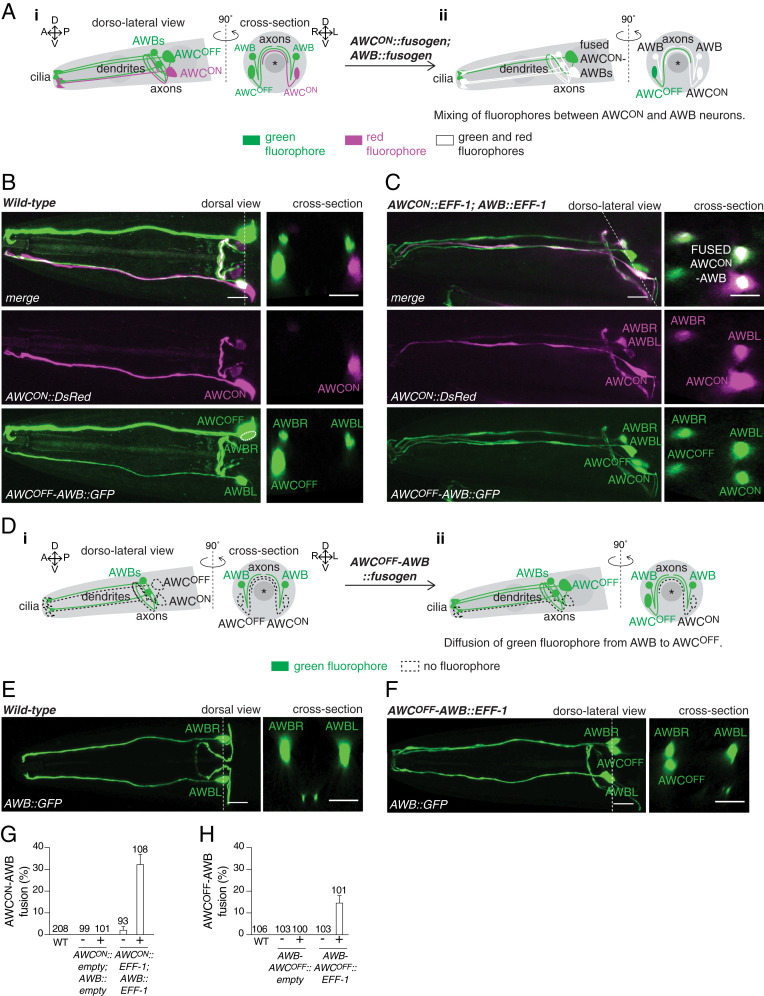
Fig. 2.
Misexpression of fusogens leads to cell−cell fusion between attractive and repulsive chemosensory neurons. (A) Scheme of the AWCON, AWCOFF, and AWB chemosensory neurons, and the fusion of the attractive AWCON with the repulsive AWB neurons. (i) In a wild-type animal, AWB neurons express a cytoplasmic green fluorohore (Psrsx-3::GFP), whereas the AWCON neuron expresses a cytoplasmic red fluorophore (Pstr-2::DsRed). (ii) Concurrent expression of fusogens in AWCON and AWB neurons (AWCON::fusogen; AWB::fusogen) results in the mixing of red and green fluorophores between these neurons. Asterisk represents the pharynx. (B and C) (Left) Representative confocal maximum z-projection images of the head of a wild-type animal (B), and an animal with AWCON−AWB fusion (C). (Right) Cross-sections at the level of the cell bodies (indicated by a dotted line on the dorsal/dorso-lateral views). Image in B is the same as shown in Fig. 1B. (Scale bars, 10 µm.) (D) Scheme of the attractive AWCOFF and the repulsive AWB chemosensory neurons, and fusion of these cells. (i) In a wild-type animal, AWB neurons express a cytoplasmic green fluorophore (Pstr-1::GFP). (ii) Concurrent expression of fusogens in AWCOFF and AWB neurons (AWCOFF−AWB::fusogen) results in diffusion of the green fluorophore from AWB to the AWCOFF neuron. Asterisk represents the pharynx. (E and F) (Left) Representative confocal maximum z-projection images of the head of a wild-type animal (E), and an animal with AWCOFF−AWB fusion (F). (Right) Cross-sections at the level of the cell bodies (indicated by a dotted line on the dorsal/dorso-lateral views). (Scale bars, 10 µm.) (G and H) Quantification of AWCON-AWB (G), and AWCOFF-AWB (H) fusion events in 1-d-old adult animals carrying either an empty vector or EFF-1 under promoters driving expression in these cells (Pstr-1::eff-1; Pstr-2::eff-1 for AWCON−AWB fusion; Psrsx-3::eff-1 for AWCOFF−AWB fusion). These quantifications only account for specific AWC−AWB fusion, excluding AWC−AWB fusion with other neurons. Results are representative of at least two independent transgenic strains (except for the wild-type control for AWB−AWCOFF fusion). N values are indicated in the graph. Error bars represent the SE of proportion.

