Fig. 2.
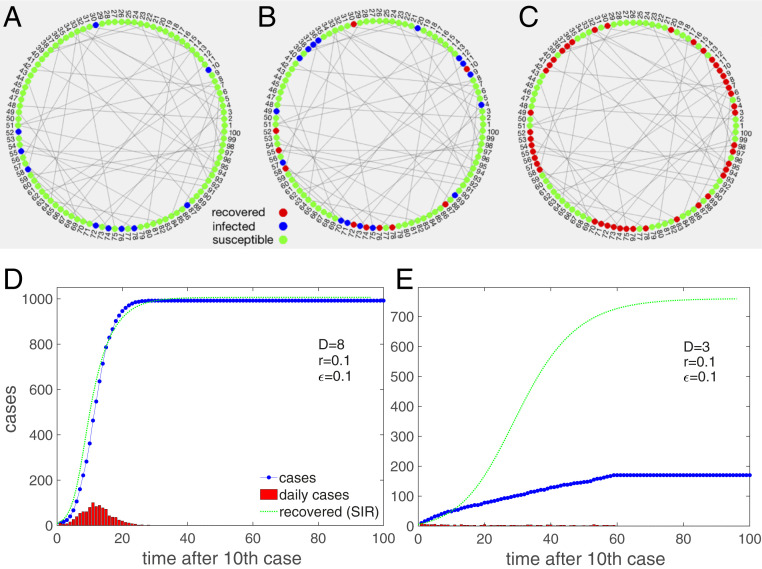
Schematic demonstration of the model. Nodes are connected in a Poissonian small-world network. Locally close neighbors resemble the family contacts, and long links to different regions represent contacts to others, such as people at work. (A) Initially, a subset of nodes is infected (blue), and most are susceptible (green). (B) At every timestep, infected nodes spread the disease to any of their neighbors with probability . After days infected nodes turn into “recovered” and no longer spread the disease. (C) The dynamics end when no more nodes can be infected and all are recovered. (D) Infection curve (blue dots) for the model on a dense Poissonian small-world network, . The daily cases (red) first increase and then decrease. For comparison, we show the recovered cases, , of the corresponding SIR model with , and (green). The mean-field conditions are obviously justified to a large extent. (E) Situation for the same parameters except for a lower average degree, . The infection curve now increases almost linearly; daily increases are nearly constant for a long time. The dynamics reach a halt at about 17% infected. The discrepancy to the SIR model (green) is now obvious.

