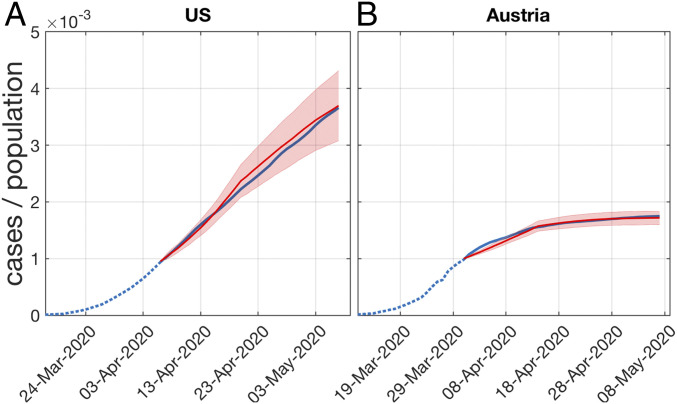
Fig. 4.
Model infection curves (red) when calibrated to the COVID-19 curves of positively tested in (A) the United States and (B) Austria. Five realizations with different sets of initially infected are shown. The simulation starts when more than 0.1% of the population tested positive. The situation in the United States assumes a Poissonian small-world network with average (daily) degree . The lockdown scenario in Austria that has been in place from 16 March to 15 May 2020 is modeled with social contacts limited to households, . For the choice of the other model parameters, see main text. The model clearly produces the correct type of infection curves.

