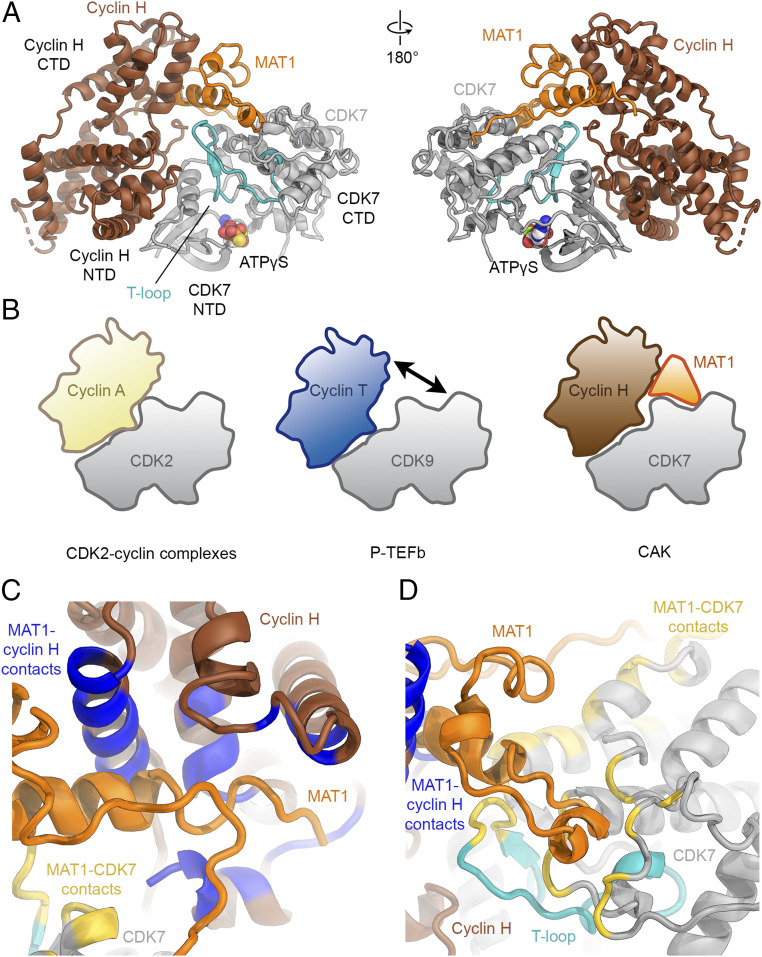
Fig. 2.
Structure of the human CAK and role of MAT1 in its architecture. (A) Atomic model of CAK shown in “front” and “back” views (CDK7 gray with the T-loop shown in teal, cyclin H brown, and MAT1 orange). (B) Schematics of the architecture of CDK2-containing complexes, transcriptional CDK complexes, and CAK. (C and D) Interactions of MAT1 with cyclin H and CDK7. Contact sites (distance <4 Å) on cyclin H are colored blue, contact sites on CDK7 are colored yellow, and the T-loop is shown in cyan.

