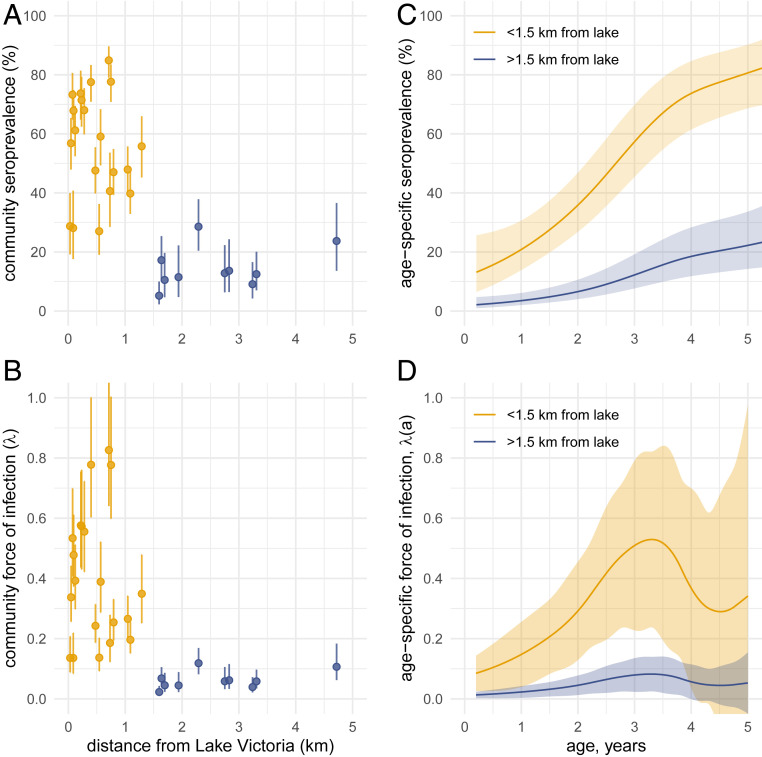
Fig. 4.
Schistosoma mansoni SEA seroprevalence and force of infection among preschool-age children by distance to Lake Victoria and age in Mbita, Kenya, 2012 to 2014. (A) Relationship between distance from Lake Victoria and community-level SEA seroprevalence in the 30 study communities over the 3-y period. Vertical bars mark exact 95% binomial CIs. (B) Relationship between distance from Lake Victoria and community-level force of infection estimated by the SEA seroconversion rate in the 30 study communities. Vertical bars on community-level force of infection estimates mark 95% CIs estimated from a semiparametric proportional hazards model. In A and B, points are colored by communities further than 1.5 km from the lake, used to examine differences in age-varying force of infection. (C) Age-dependent seroprevalence estimated with cubic splines, stratified by distance to Lake Victoria. (D) Age-dependent force of infection derived from seroprevalence curves in C. Shaded regions in C and D indicate approximate simultaneous 95% CIs. Created with notebooks: https://osf.io/fnxs7/ and https://osf.io/dnckx/.

