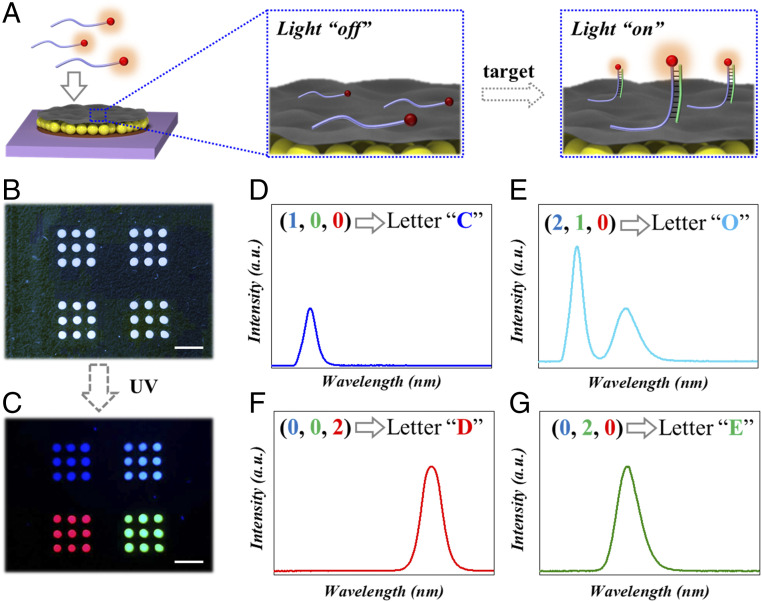
Fig. 4.
(A) Schematic illustration of the fluorescence signal from “off” to “on” on the MXene-integrated PhC arrays. (B) Bright field and (C) fluorescent field image of an array with information “CODE.” (D–G) Fluorescence spectra corresponding to four different fluorescent patterns and their coding information. (Scale bars are 5 mm in B and C.)

