Fig. 1.
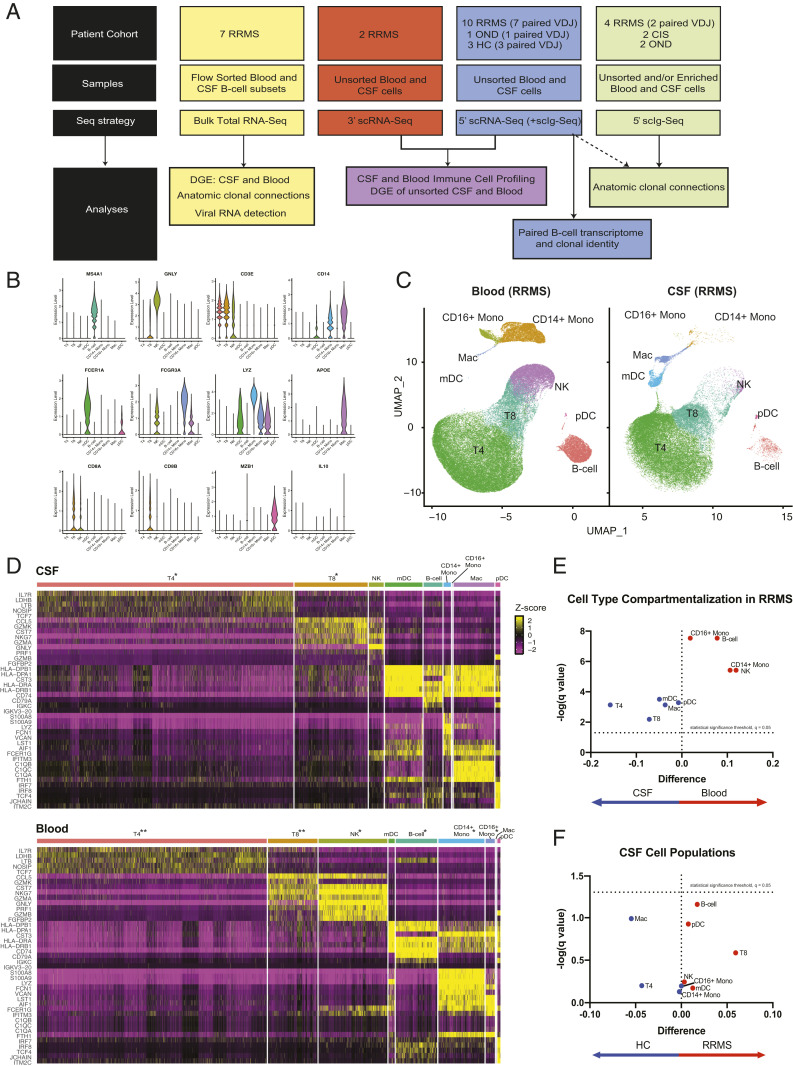
Study overview and the CSF immune landscape in HCs and RRMS subjects. (A) A schematic representation and overview of sample collection, processing, and bioinformatic analysis. (B) Representative violin plots of paired CSF and blood from 5′ scRNA-Seq (n = 10 RRMS). The expression of canonical genes is shown for each of the Seurat clusters generated, with manual cell type annotations inputted for each Seurat cluster. (C) The 5′ gene expression from the samples represented in B with UMAP coordinates, and in D, heat maps for CSF (Upper) and blood (Lower) are shown. The top five genes exhibiting the strongest differential expression for each of the major lineages are displayed. The following scaling factors were chosen to maintain the overall proportion of cell types found in the CSF and blood: *Cell type down sampled by 66.67% to enable visualization of low-proportion cell types; **Cell type down sampled by 90% to enable visualization of low-proportion cell types. (E) Volcano plot of difference in proportion of each major cell type in the CSF compared with the blood with false discovery Q value of 0.05 for multiple t tests represented as a dashed line on a log scale. (F) Similar volcano plot of difference in proportion of each major cell type in RRMS vs. HC.

