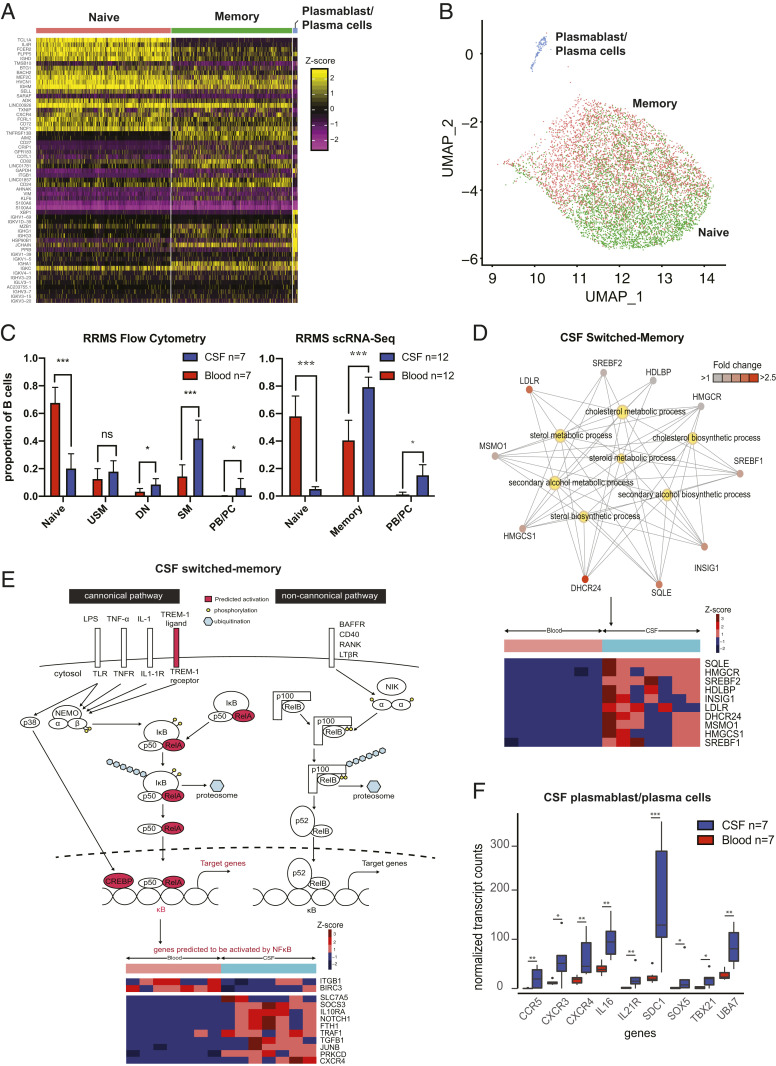
Fig. 2.
Single-cell and bulk profiling of B cells in RRMS. (A) Heat map of B cells from paired RRMS CSF and blood samples from the 5′ scRNA-Seq gene expression analysis (n = 10 subjects) revealing clustering into three main groups of B cells. (B) Representation of this dataset in UMAP space extracted from and zoomed in on from the UMAP coordinates represented in Fig. 1C. Annotations generated algorithmically using SingleR with the Encode reference set. (C) Flow cytometry B cell results from 7 paired RRMS blood and CSF samples for bulk RNA-Seq and 12 paired RRMS blood and CSF samples (n = 10 from 5′ and n = 2 from 3′ scRNA-Seq) from scRNA-Seq. Statistical tests were performed using the Mann–Whitney U test; mean ± SEM is shown. (D) Network diagram of CSF switched memory cells with a focus on the cholesterol biosynthesis pathways (Upper) and corresponding heat map of differentially expressed genes (Lower) in the bulk RNA-Seq cohort. Pathway data were generated using clusterProfiler. Genes are depicted as outer nodes in shades of red (corresponding to fold enrichment), while GO terms are highlighted centrally in yellow. (E) Schematic representation of upstream NF-κB pathway members predicted to be activated (Upper), and heat map of differentially expressed downstream NF-κB pathway members genes (Lower) in CSF SM cells from the bulk RNA-Seq cohort. (F) Normalized expression of genes involved in inflammatory pathways in CSF and blood plasmablast/plasma cells. PB/PC, plasmablast/plasma cells. *P < 0.05, **P < 0.01, ***P < 0.001.

