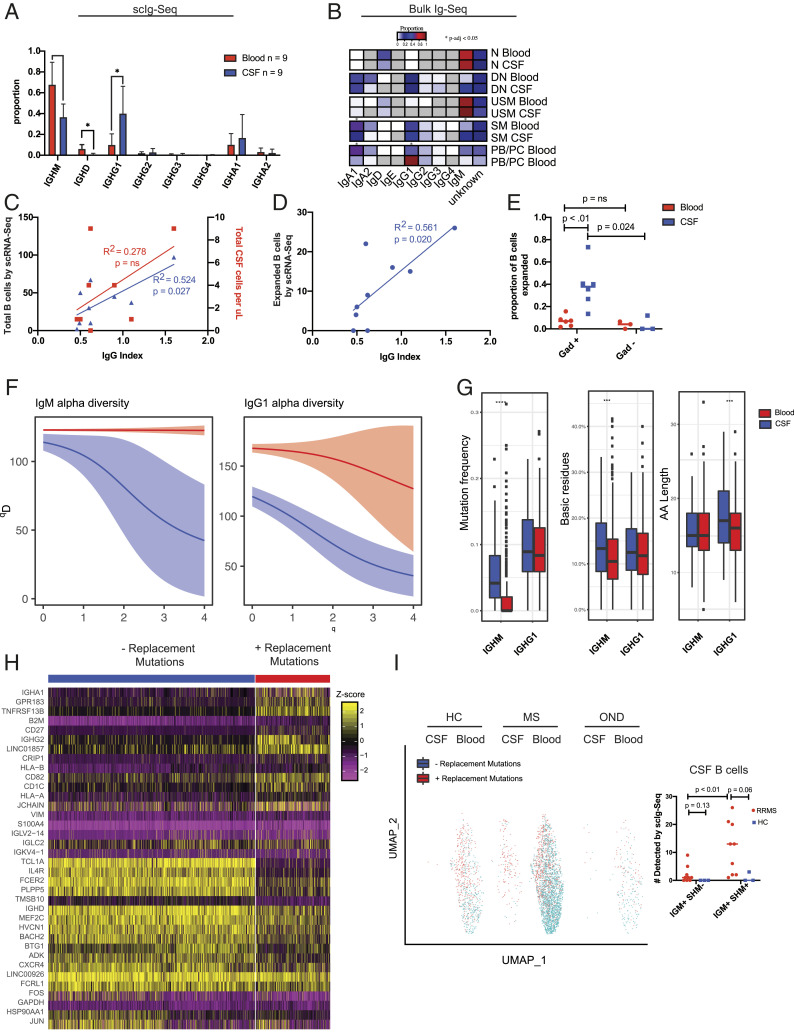
Fig. 3.
Paired scIg-Seq in RRMS ties clonal B cell expansion to intrathecal Ig synthesis and blood–brain barrier breakdown and to the emergence of IgM+ B cells undergoing SHM in the CSF. (A) Isotype usage by scIg-Seq in the 5′ dataset from n = 9 paired CSF and blood RRMS subjects. Statistics were performed with Mann–Whitney U test; mean ± SD is shown. (B) Isotype usage by limited Ig-Seq data extracted from bulk RNA-Seq. (C) Linear correlation between the clinical CSF WBC count vs. total B cells by scRNA-Seq and the clinical IgG index. (D) Linear correlation between the number of expanded B cells detected by scRNA-Seq and the clinical IgG index. (E) Enrichment of clonally expanded CSF, but not blood, B cells in the same subjects with active gadolinium on MRI. Statistics performed with Mann–Whitney U test. (F) Alpha diversity plots from the Immcantation framework depicting restricted diversity in the CSF relative to the blood for both IgM+ and IgG1+ B cells (n = 9 RRMS subjects). There were too few B cells in the HCs to generate comparison plots. Blood is depicted in red, and CSF is depicted in blue. (G) Mutation frequency, basic residue count, and CDR3 length in the CSF and blood of RRMS subjects by scIg-Seq. Statistical test was performed using a Student’s t test. (H) Heat map of the top 20 most differentially expressed genes by the Seurat FindMarkers command in IgM+ B cells with and without replacement mutations. (I) UMAP of IgM+ B cells from scIg-Seq overlaid onto 5′ scRNA-Seq gene expression data from HC (n = 3; 2 had zero B cells with productive VDJ sequences), RRMS (n = 7), and OND (n = 1) subjects. Dot plot adjacent to UMAP with statistical testing comparing the total number of B cells detected in the CSF and blood with either IGM+ SHM or IGM− SHM. Statistical testing was performed with the Mann–Whitney U test. PB/PC, plasmablast/plasma cells; WBC, white blood cell. *P < 0.05, ***P < 0.001, ****P < 0.0001.

