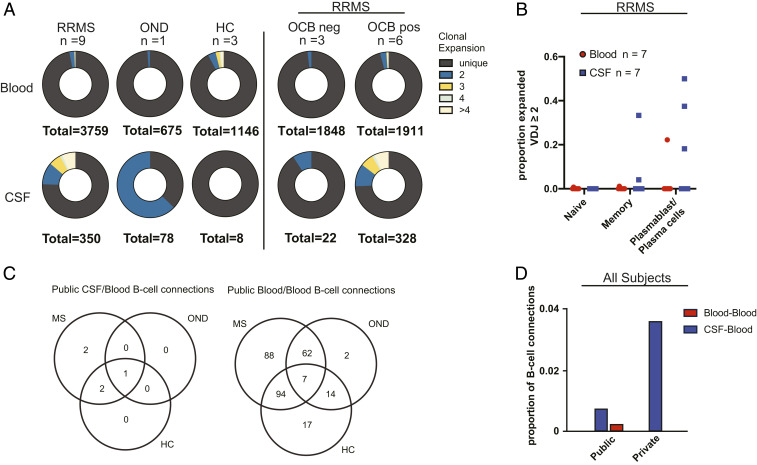
Fig. 4.
(A) Donut charts of paired scIg-Seq results from blood and CSF in RRMS (n = 9), OND (n = 1), and HC (n = 3; 2 subjects had zero CSF B cells by scIg-Seq). Adjacent plots demonstrating clonal expansion in RRMS subjects with or without unique CSF oligoclonal bands (OCBs). Unique indicates a clone seen in only one cell in a subject’s sample. Clonal expansion was further divided into clone counts of two, three, four, and more than four. (B) Dot plot of cell types with clonal expansion in seven RRMS subjects in whom overlapping gene expression data were available. (C) Venn diagrams of shared B cells, determined by highly similar Ig heavy-chain sequences in the scIg-Seq cohort from an expanded set of subjects, including those without paired CSF and blood samples and with sorted B cell subsets as listed in Fig. 1A and Dataset S1 (n = 14 RRMS, n = 3 HC, n = 3 OND, n = 2 CIS). (D) Proportions of public (present in more than one subject) and private (present in only one subject) CSF B cells connected to blood (CSF/blood) and public blood B cells connected to other blood B cells (blood/blood). Of 693 total CSF B cell connections, 5 of 693 were highly similar to blood across subjects (publicly), and 25 of 693 were highly similar to blood within the same subject (privately). Of the 137,416 blood B cell connections, 284 of 137,416 were shared publicly.

