Fig. 5.
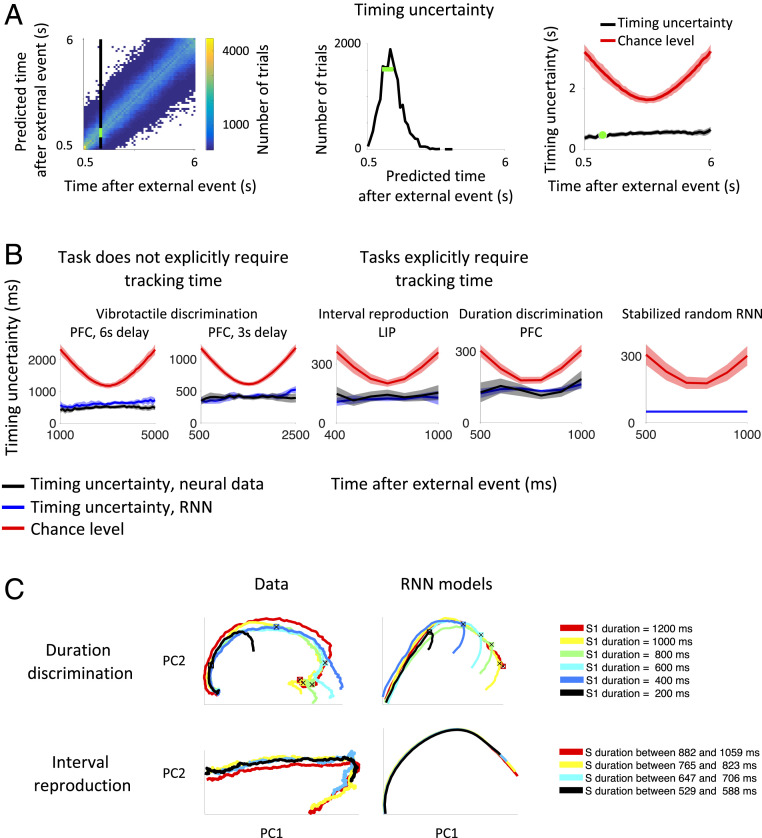
(A) To quantify the precision with which time is encoded, we estimated the temporal uncertainty at each point in time by training a classifier to report the time point a neural recording was made and then compare this prediction with the actual time (SI Appendix, Fig. S3); we repeat this classification for many trials, obtaining a distribution about the true time. Left shows the distribution of predicted versus actual times for the vibrotactile-discrimination task, excluding the initial transient after stimulus offset. The distribution of predictions at a single time point, marked by the vertical black line, is replotted in Center. The green bar shows the SD of this distribution. The “timing uncertainty” is the SD of this distribution and contributes a single data point to the “timing uncertainty” graph (Right) (green dot). The timing uncertainty for all time points is shown in black. The chance level is shown in red. (B) The timing uncertainty for the neural data (black curves) and RNN models (blue curves) is less than chance level (red curves) and has better resolution for tasks in which timing information is explicitly required, as in the duration-discrimination task and the ready-set-go interval-reproduction task (note the scales on the y axes are different). This is consistent with the idea that stable neural trajectories act as a clock to perform the task. Error bars show two SDs. (C) Visualization of these putative neural clocks after projecting the neural activity onto the first two principal components capturing the most variance. The left column shows the data for the two tasks that require keeping track of time, and the right column shows the RNN models. Trajectories show the intervals when time is being tracked. For the duration-discrimination task, this is the interval when stimulus one (S1) is on the screen. For the interval-reproduction task, this is the “sample” interval between ready and set cues, denoted by S in the figure legend. Colors indicate the duration of the interval. To better visualize these neural clocks, we include data from all durations, not just durations over 1,000 ms as in B. Principal axes were computed using only data from the longest duration (red curves; first principal component explains over 50% of the variance for all datasets and models), and then data from the shorter durations were projected onto these axes. The black crosses plotted on the trajectories of the duration-discrimination task indicate when the visual stimulus changed to indicate when the monkey should stop counting the duration of the interval, i.e., S1 offset. After this cue, the neural activity gets off the “clock.” All neurons were included that were recorded for 10 or more trials for each duration.

