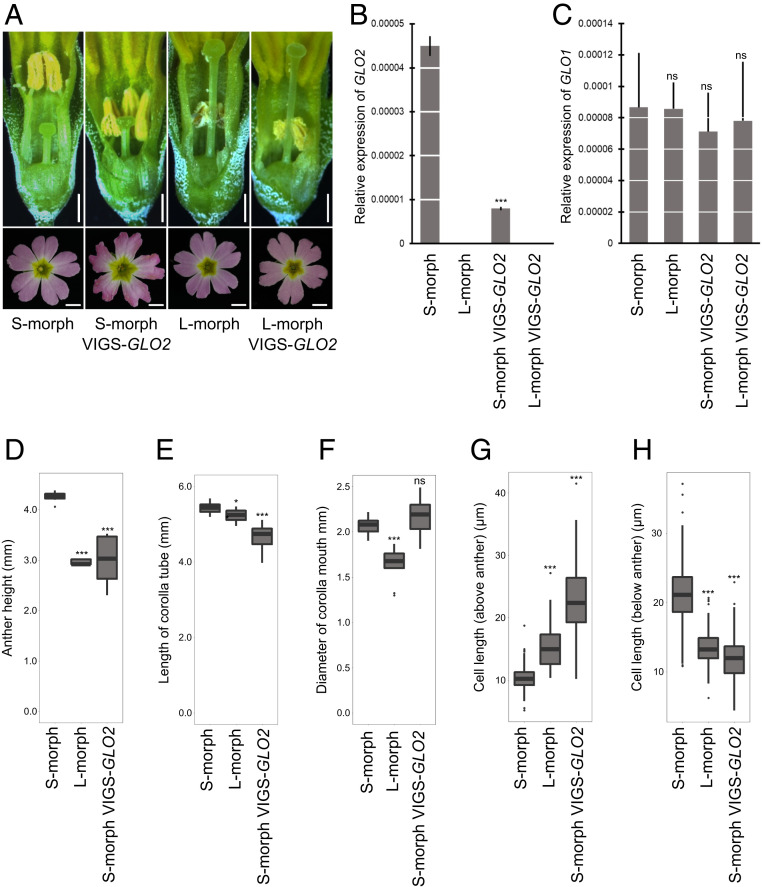
Fig. 1.
VIGS of GLO2 results in short-homostylous flowers. (A) Short-homostylous phenotypes in VIGS-GLO2–treated S (short-styled)-morph plants. Images were taken in dissected flowers (Top) and from the top of flowers (Bottom). Arrow indicates the position of anthers. (Scale bars, 1 mm.) (B) Expression of GLO2 in untreated S- and L (long-styled)-morph plants and in VIGS-GLO2–treated S- and l-morph plants. Values represent the mean ± SD from three biological replicates. Asterisk indicates significant difference from S-morph flowers by Student’s t test with ***P < 0.001. (C) Expression of GLO1 in untreated S- and l-morph plants and in VIGS-GLO2–treated S- and l-morph plants. Values represent the mean ± SD from three biological replicates. Student’s t test showed no significant difference (ns) between samples. (D–F) Anther height (D), length of corolla tube (E), and diameter of corolla mouth (F) as measured in untreated S- and l-morph and in VIGS-GLO2–treated S-morph plants. The lines in the boxes indicate the median, the boxes show the interquartile range and the whiskers indicate the largest and smallest values within 1.5x interquartile ranges above the 75th or below the 25th percentile, respectively, from n = 10 flowers. Asterisks indicate significant difference from S-morph flowers by Student’s t test with *P < 0.05 and ***P < 0.001. (G and H) Length of corolla cells above (G) and below (H) the anther in untreated S- and l-morph plants and in VIGS-GLO2–treated S- and l-morph plants. Ten corolla tubes from each phenotype were measured and values are the mean ± SD. Asterisks indicate significant difference from S-morph flowers by Student’s t test with ***P < 0.001.

