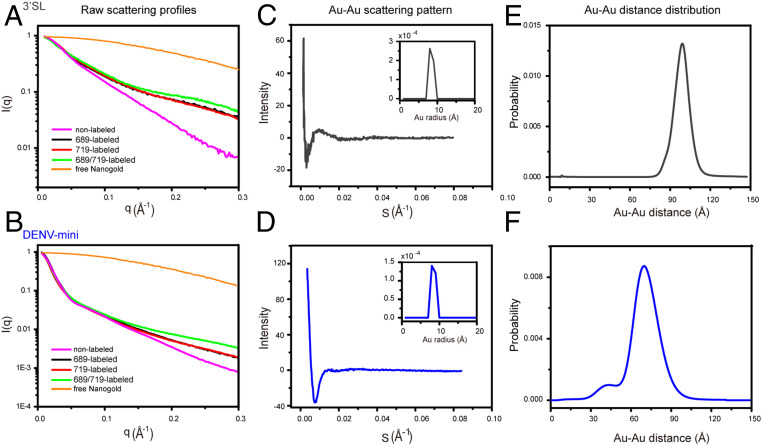
Fig. 6.
Measuring Nanogold–Nanogold distance distributions from Nanogold-conjugated 3′SL and DENV-mini RNA samples by XSI. (A and B) I0-normalizzed scattering profiles of free Nanogold (orange), 689 single-labeled (black), 719 single-labeled (red), 689/719 double-labeled (green) Nanogold-RNA conjugates, nonlabeled native RNA (magenta) for 3′SL (A), and DENV-mini (B). (C and D) Scattering interference pattern of the two Nanogold labels in 3′SL (C) and DENV-mini (D). The Insets are the radius distribution of the free Nanogold used in the experiment, showing a maximum probability at 7 Å. (E and F) Probability distribution of the center-to-center distance between the two Nanogold labels in 3′SL (97.7 Å) (E) and DENV-mini (78.2 Å) (F) with variance of 52.7 and 83.3 Å2, respectively. A shoulder peak with mean distance of 40 Å was observed for DENV-mini.

