Fig. 1.
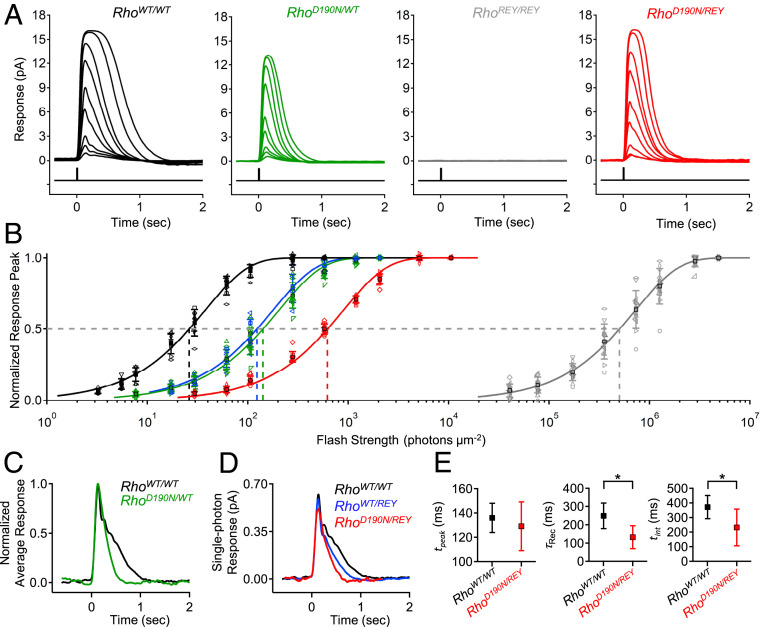
Lower flash sensitivity and faster response kinetics of RhoD190N/WT rods compared to WT, and isolation of D190N-Rho responses in RhoD190N/REY. (A) Flash response families for RhoWT/WT (C57BL/6J, black), RhoD190N/WT (green), RhoREY/REY (gray), and RhoD190N/REY (red) rods. REY-Rho responses were not observed in RhoREY/REY rods in a flash response family of ∼30 to 10,000 photons⋅µm−2⋅s−1, while D190N-Rho responses were robust in RhoD190N/REY rods over the same range. (B) Intensity–response relations of normalized response peak versus flash strength for each genotype shown in A in addition to that of RhoWT/REY rods. The solid curves are fits to a saturating-exponential function (Methods) with half-saturating flash strengths (ρ) of 26 (RhoWT/WT), 142 (RhoD190N/WT), 124 (RhoWT/REY), 622 (RhoD190N/REY), and 502,754 (RhoREY/REY) photons⋅µm−2. (C) Normalized, averaged dim-flash responses for RhoWT/WT rods (black) and RhoD190N/WT rods (green). (D) Single-photon responses (obtained from quantal fluctuation analysis) of WT-Rho in RhoWT/WT rods (black), D190N-Rho in RhoD190N/REY rods (red), and WT-Rho in RhoWT/REY (blue). (E, Left) Time-to-peak (tpeak) of single-photon responses from WT-Rho (black) and D190N-Rho (red); tpeak = 136 ± 12 ms (RhoWT/WT; n = 9 cells) and 129 ± 20 ms (RhoD190N/REY; n = 12 cells). (E, Center) Recovery time constant (τRec) from fitting the final exponential decline of the single-photon response; τRec = 249 ± 70 ms (RhoWT/WT), 132 ± 63 ms (RhoD190N/REY). (E, Right) Integration time (tint) of single-photon response (defined as the time integral of single-photon response divided by transient peak amplitude), tint = 371 ± 79 ms (RhoWT/WT), 232 ± 126 ms (RhoD190N/REY). The single stars mark statistical significance of 0.0001 ≤ P ≤ 0.05 from Student’s t tests. There was no statistically significant difference in time-to-peak.

