Fig. 6.
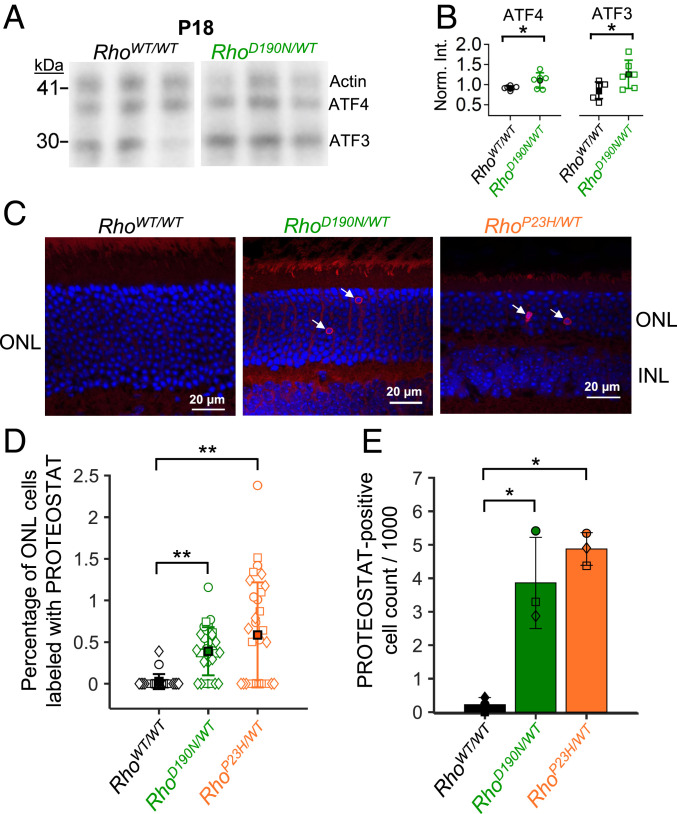
Induction of the unfolded protein response and detection of misfolded protein aggregates. (A) Immunoblots of ATF4 and ATF3, which are involved in the unfolded protein response. Actin was costained for normalization. Blots from three animals each of P18 RhoWT/WT (Left) and RhoD190N/WT (Right) are shown. (B) Band intensity normalized to actin for each sample. Both ATF4 and ATF3 were significantly up-regulated in retinal extracts from P18 RhoD190N/WT;Gnat1+/+ animals (P < 0.05). (C) Cryosections and fluorescent labeling using PROTEOSTAT dye to stain RhoWT/WT (Left), RhoD190N/WT (Middle), and RhoP23H/WT (Right) retinae. (D) Percentage of PROTEOSTAT-positive cells across images. Each symbol represents the percentage from a single image as shown in C. Circles, squares, and diamonds represent data from each of three animals. (E) Overall density of PROTEOSTAT-positive cells per 1,000 cell bodies counted in the outer nuclear layer in each animal (n = 3 animals). Each symbol (circle, square, or diamond) represents the PROTEOSTAT-positive cell density from an individual animal. The single stars mark statistical significance of 0.0001 ≤ P ≤ 0.05, and the double stars mark P < 0.0001. Comparing RhoD190N/WT and RhoP23H/WT, there was not a statistically significant difference in the densities of PROTEOSTAT-positive cells.

