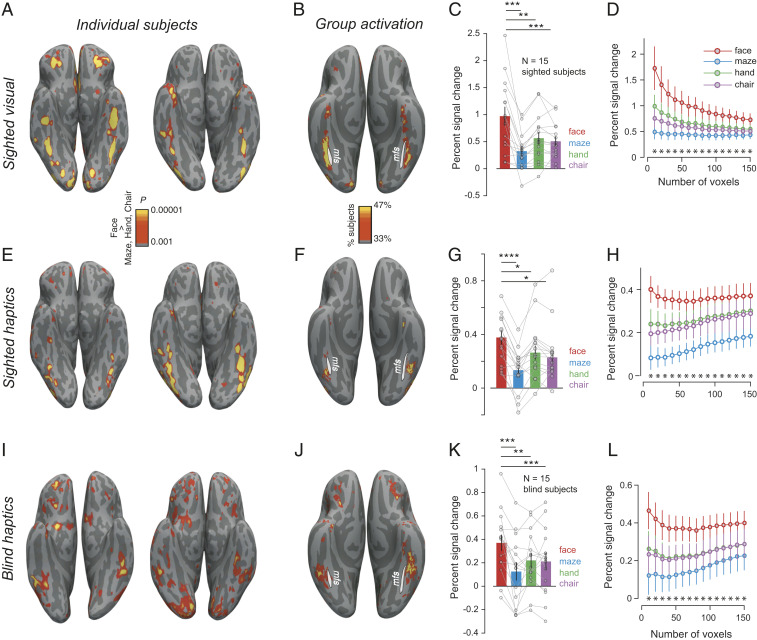
Fig. 2.
Face-selectivity in sighted and blind. (A) Visual face-selective activations (faces > hands, chairs, and mazes) on the native reconstructed surface for two sighted subjects. (B) Percent of sighted subjects showing significant visual face-selectivity (at the P < 0.001 uncorrected level in each participant) in each voxel registered to fsaverage surface. White line shows the location of the midfusiform sulcus (mfs). (C) Mean and SEM of fMRI BOLD response across sighted subjects in the top 50 face-selective voxels (identified using independent data) during visual inspection of face, maze, hand, and chair images. Individual subject data are overlaid as connected lines. (D) Response profile of visual face-selective region (in held-out data) in sighted participants as a function of fROI size (error bars indicate the SEM). Asterisks (*) indicate significant (P < 0.05) difference between faces and each of the three other stimulus categories across subjects. (E–H) Same as A–D but for sighted subjects during haptic exploration of 3D-printed stimuli. (I–L) Same as A–D but for blind subjects during haptic exploration of 3D-printed stimuli. *P < 0.05, **P < 0.005, ***P < 0.0005, and ****P < 0.00005.

