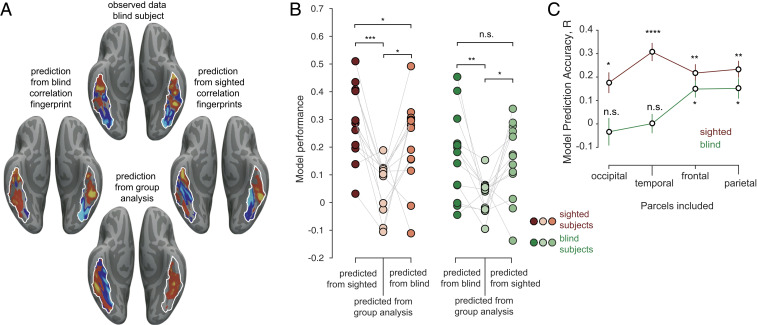
Fig. 4.
CFs predict the spatial locations of face selectivity. (A, Top) Observed face-selective activation in an example blind subject (z-scored units). Predicted activations for the same subject based on that individual’s CF using a model trained on other blind subjects’ haptic activations (Left), or on sighted subjects’ visual activations (Right). (Bottom) predicted activation based on group analysis of face-selective responses in other blind subjects. (B) Model prediction performance across blind and sighted subjects. Each dot is the model prediction accuracy for a single sighted (Left, red) and blind (Right, green) subject. Model predictions were obtained from CFs derived from either the same group (left column in each set), the functional group analysis of the remaining subjects (middle column in each set) or from CFs of the opposite group (right column in each set). Paired t tests were performed on Fisher-transformed data. *P < 0.05, **P < 0.005, ***P < 0.0005, ****P < 0.00005, and n.s., not significant. (C) Model prediction accuracy of face selectivity for sighted (visual responses) and blind (haptic responses) based on CFs including only target regions within one lobe at a time. Statistics indicate significantly better prediction from CFs than from the random-effects analysis of face-selectivity in the rest.

