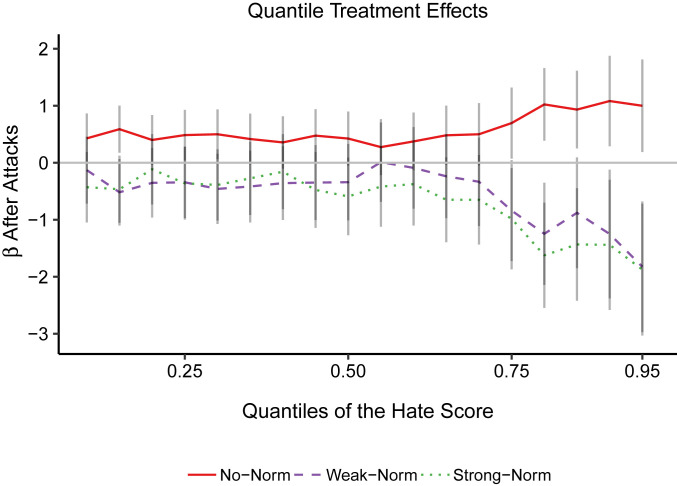
Fig. 3.
The plot depicts the estimated model coefficients of the effect on terrorist attacks for quantiles 10th to 95th in comments on refugees for all levels of the descriptive norm: no norm, weak norm, and strong norm. The reference category is the preattacks distribution of the hate score in the no-norm condition. The gray vertical lines represent the confidence interval of the quantile regression coefficients for the effect of terrorist attacks with 95% confidence level.

